10
$\begingroup$

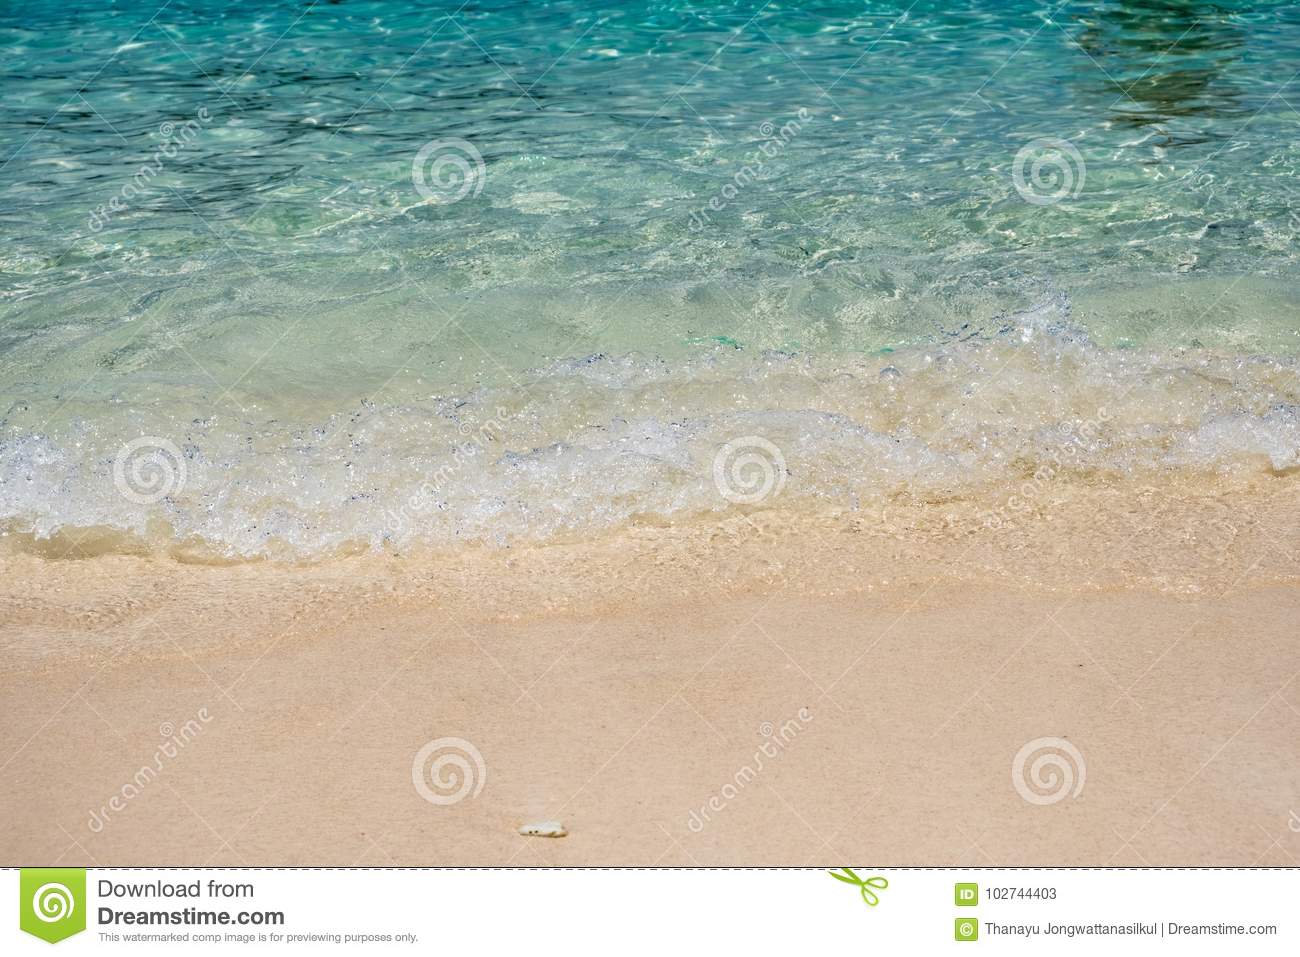
I wonder how one can manipulate options like PlotStyle, Lighting, and Specularity to make the plot look like crystal ocean waves: enter image description here Example plot:

RegionPlot3D[z <= .3 Sin[3 x] + 1 && x <= 0,
 {x, -2, 1}, {y, -2, 1}, {z, 0, 2.5},
 PlotStyle -> Directive[RGBColor[.8, .8, 1, .5]], 
 Lighting -> {{"Directional", LightBlue, {{0, 0, 0}, {-1, -1, -2}}}},
 Mesh -> None, Axes -> None, BoxStyle -> Dashed,
 BoxRatios -> Automatic]
$\endgroup$
7
  • 1
    $\begingroup$ I don't understand. What do you want to reproduce? The color? The shape? $\endgroup$
    – MarcoB
    Commented Jan 28, 2021 at 15:10
  • $\begingroup$ @MarcoB I just want to imitate the color. (Too difficult to reproduce the shape) Any method including Texture is welcome! $\endgroup$ Commented Jan 28, 2021 at 15:17
  • 2
    $\begingroup$ I don't think Mathematica's there yet. You could adjust the opacity and the normals for a surface, but the water-like appearance (caustics, reflections, etc.) is not something I believe is easily done with what we now have. $\endgroup$ Commented Jan 28, 2021 at 15:28
  • 1
    $\begingroup$ I wasn't kidding about "not there yet": Plot3D[Sin[x + Sin[y]], {x, 0, 2 Pi}, {y, 0, 2 Pi}, BoundaryStyle -> None, Lighting -> "Neutral", Mesh -> None, PlotPoints -> 45, PlotTheme -> "Classic", PlotStyle -> Directive[Opacity[0.8, ColorData["Legacy", "PowderBlue"]]]] or Plot3D[Sin[x + Sin[y]], {x, 0, 2 Pi}, {y, 0, 2 Pi}, BoundaryStyle -> None, ColorFunction -> "DeepSeaColors", Lighting -> "Neutral", Mesh -> None, PlotPoints -> 45, PlotStyle -> Opacity[0.6], PlotTheme -> "Classic"] $\endgroup$ Commented Jan 28, 2021 at 16:01
  • 2
    $\begingroup$ I might as well link to this article in case someone gets inspired... $\endgroup$ Commented Jan 29, 2021 at 3:32

2 Answers 2

17
$\begingroup$

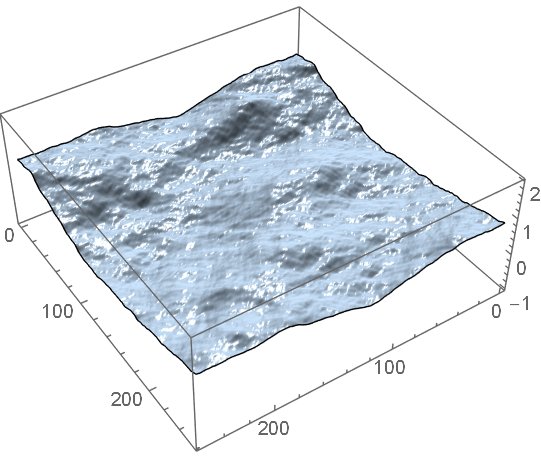
You can get a little bit of sparkling by using a high Specularity coefficient, but the result tends to look more like shiny plastic than water.

(* not a real ocean wave spectrum *)
f[x_, y_] := x/(x^2 + y^2)^(3/2)

ocean = Module[{n = 256, x, spectrum, r},
   x = N@RotateRight[Range[-n, n - 2, 2], n/2];
   spectrum = Quiet@Outer[f, x, x];
   spectrum[[1, 1]] = 0.0;
   r = RandomReal[NormalDistribution[0, 1], {n, n}] + 
     I RandomReal[NormalDistribution[0, 1], {n, n}];
   Rescale[Re[Fourier[r spectrum]]]];

ListPlot3D[ocean, PlotRange -> {-1, 2}, 
 PlotStyle -> {RGBColor[0.8, 0.9, 1.], Specularity[White, 200]}, 
 Lighting -> {{"Directional", White, {0, 0, 10}}}, Mesh -> False]

enter image description here

$\endgroup$
6
  • $\begingroup$ Considering Mathematica's limitations, this is pretty good. $\endgroup$ Commented Jan 29, 2021 at 0:53
  • $\begingroup$ This answer shows that shape is also important, as the same set of your style options, if applied to the original function in my question, only makes it look like some wavy plastic toy. In comparison, your plot is more like the surface of the ocean, which may get a better look if we remove the black boundary line and fill the region below the plotted surface with clear water. :) $\endgroup$ Commented Jan 29, 2021 at 6:48
  • 1
    $\begingroup$ @Sneeze, "if we remove the black boundary line" - add BoundaryStyle -> None to Simon's plot. "fill the region below the plotted surface" - and add Filling -> Bottom too. $\endgroup$ Commented Jan 29, 2021 at 7:54
  • 1
    $\begingroup$ Yes, getting a plausible shape helps a lot, because then the lighting calculation does the hard work. As noted, the spectrum I used isn't at all accurate but it gets the idea across. You can try varying the power in the denominator of f for different effects. Smaller values (eg 1.35) will give you a more crinkly surface, higher values (eg 1.65) will appear smoother. $\endgroup$ Commented Jan 29, 2021 at 22:24
  • 1
    $\begingroup$ This ocean wave looks promising! I'll try putting it into a proper render engine to see what comes out! $\endgroup$
    – Silvia
    Commented Apr 7, 2021 at 17:21
15
$\begingroup$

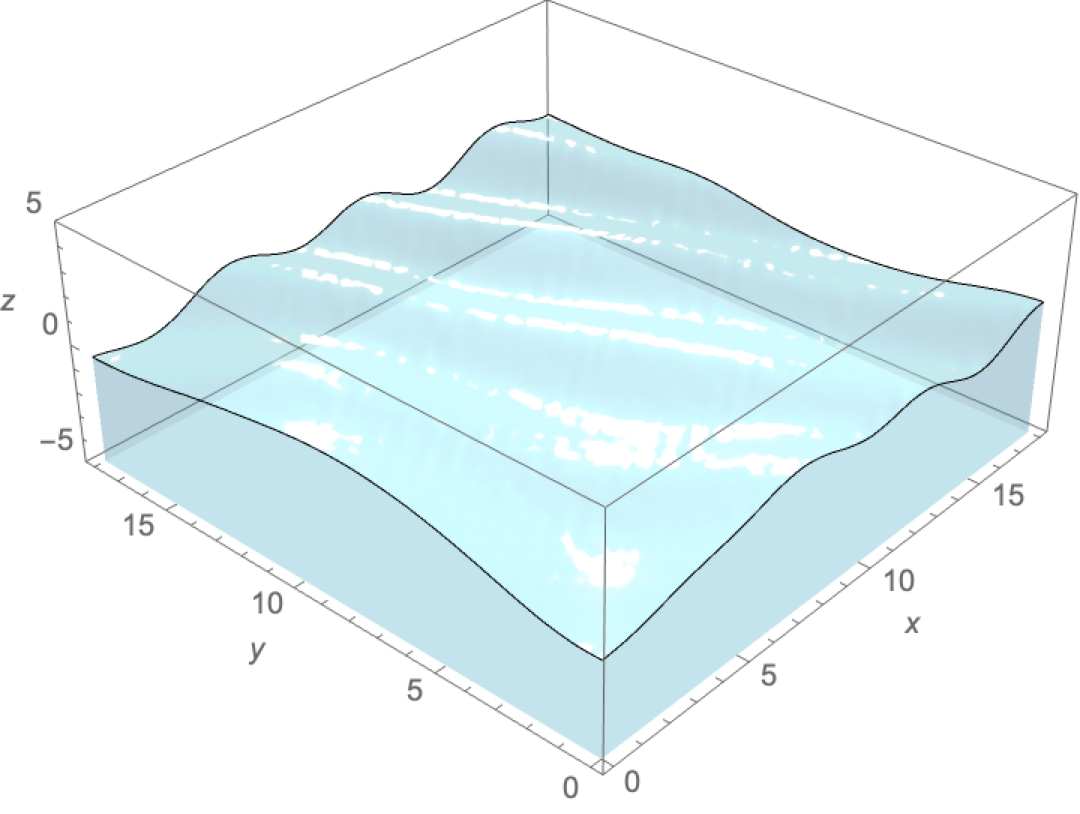
Rotate it around and you'll see that M is "not there yet" as @J.M. notes. From just about any point of view, it cannot really model sunlight reflecting off the surface. (If M can, then I can't get it to.)

SeedRandom[0];
waves = With[{n = 20}, 
   MapThread[
     Sin[#1^4 First@RotationMatrix[#2] . {x, y} + #3]/(1 + #1^(8)) &,
     {RandomReal[{0.2, 2.4}, n], RandomReal[{0.3, 1.2}, n], 
      RandomReal[2 Pi, n]}] // Total
   ];
col = RGBColor[0.6, 0.9, 1.];
col2 = RGBColor[1., 1., 0.8];
Plot3D[waves, {x, 0, 18}, {y, 0, 18},
 PlotRange -> 8, PlotPoints -> 75,
 Mesh -> None,
 Filling -> Bottom, FillingStyle -> Opacity[0.2, col], 
 PlotStyle -> Directive[
   Specularity[col2, 100],
   Glow[Darker[col, 0.9]],
   Opacity[0.2],
   col],
 Lighting -> {
   {"Ambient", Darker[col, 0.35]},
   {"Directional", col2, {{15, 15, 15}, {0, 0, 0}}}},
 ViewPoint -> {-2.1473148110909985`, -1.9225307125696098`, 
   1.7728267713727204`}]

enter image description here

It does make me want to go to a nice, warm beach, though.


Update

One trick to get sparkle on a translucent plot is to set the opacity to 1 and then interpolate between the two images as a function of brightness. One can only do this on Image once the lighting and view point are set, so the image cannot be rotated. (Got to work on the waves, some sort of combination of waves and @Simon's texture.)

SeedRandom[0];
waves = With[{n = 8, k = 2}, 
   MapThread[
      Sin[#1^4 First@RotationMatrix[#2] . {x, (2 y + Sin[#1^2 y/(1 + #1)])/3} + #3]/(1 + (#1 - 1/8)^(7)) &,
      {RandomReal[{0.7, 1.}, k]~Join~RandomReal[{1.5, 3.0}, n - 2 k], 
       RandomReal[{0.8, 1.2}, k]~Join~RandomReal[{1., 1.6}, n - 2 k], 
       RandomReal[2 Pi, n - k]}
    ]~Join~
     MapThread[
      Sin[#1^4 First@RotationMatrix[#2] . {x, (2 y + Sin[#1 y/(1 + #1)])/3} + #3]/(5/2 + (#1)^( 4)) &,
      {RandomReal[{1., 1.2}, k], RandomReal[{2.2, 2.6}, k], RandomReal[2 Pi, k]}] // Total];
col = RGBColor[0.6, 0.9, 1.];
col2 = RGBColor[1., 1., 0.8];
plot1 = Plot3D[waves, {x, 0, 18}, {y, 0, 18}, PlotRange -> 5, 
   PlotPoints -> 75, Mesh -> None, Filling -> Bottom, 
   FillingStyle -> Opacity[0.201, col], 
   PlotStyle -> Directive[Specularity[White, 400], Glow[Darker[col, 0.9]], Opacity[0.2], col], 
   Lighting -> {{"Ambient", Darker[col, 0.35]}, {"Directional", col2, {30, 30, 20}}},
   AxesLabel -> {x, y, z}, 
   ViewPoint -> {-2.1473148110909985`, -1.9225307125696098`, 1.7728267713727204`}];

img1 = Image@plot1;
img2 = Image[plot1 /. {Opacity[0.2] -> Opacity[1]}];

ixf = Compile[{{c1, _Real, 1}, {c2, _Real, 1}},
   With[{t = (1 - Sqrt@Abs[1 - (Norm[c2] - 1)]; (Norm[c2] - 1))^12},
    (1 - t) c1 + t*c2],
   RuntimeAttributes -> {Listable}, Parallelization -> True
   ];

Image[ixf[ImageData@img1, ImageData@img2], Options@img2]
enter image description here

$\endgroup$
3
  • $\begingroup$ This is more "swimming pool" than "beach", but still pretty good. ;) $\endgroup$ Commented Jan 29, 2021 at 3:29
  • $\begingroup$ @J.M. Thanks. Yeah, a beach would take caustics, and sand, and sea foam. $\endgroup$
    – Michael E2
    Commented Jan 29, 2021 at 4:36
  • $\begingroup$ Appreciate the way you introduce sparkles! Nice texture, making it difficult to decide on which answer to accept. $\endgroup$ Commented Jan 29, 2021 at 6:57

Your Answer

By clicking “Post Your Answer”, you agree to our terms of service and acknowledge you have read our privacy policy.

Not the answer you're looking for? Browse other questions tagged or ask your own question.