2
$\begingroup$

I have the following piecewise function of the variable $e_f$:

$$g(a,b,c,w,F,e_h,e_f)=\begin{cases} \frac{(c-a e_f) (e_f (4e_f w-a)+c)}{8 b e_f^2} & \left(e_f=e_h\land e_f>\frac{c}{a}\right)\lor e_f\geq \frac{c}{a-2 \sqrt{b} \sqrt{F}} \\ 0 & \text{otherwise} \end{cases} $$

where all the parameters $a$, $b$, $c$, $w$, $F$, $e_h$ and $e_f$ are strictly positive ($\gt 0$).

g[a_, b_, c_, w_, F_, eh_, ef_] := Piecewise[{{
    ((c - a ef) (c + ef (-a + 4 ef w)))/(8 b ef^2),
      (ef == eh && ef > c/a) || ef >= c/(a - 2 Sqrt[b] Sqrt[F])
  }}, 0]

For given numerical values of $a$, $b$, $c$, $w$, $F$, and for a given $e_h$, I would like to find the value of $e_f$ that maximises $g$. I tried to use the FindMaximum function, but this seems to miss the point where $e_f=e_h$ where the function may be defined and maximised. For example:

FindMaximum[g[10, 1, 1, 5, 10, 0.24, ef], {ef, 0.2}] returns {0., {ef -> 0.2}} and FindMaximum[g[10, 1, 1, 5, 10, 0.24, ef], {ef, 0.3}] returns {0.698102, {ef -> 0.272076}} which is the maximum on the continuous part for $e_f\geq \frac{c}{a-2 \sqrt{b} \sqrt{F}}$. So in both cases, the point $e_f=0.24$ where the global maximum $g(10, 1, 1, 5, 10, 0.24, 0.24)=0.753472$ is missed.

Ultimately, I would like to plot the argmax of $g(e_f)$ as a function of $e_h$ for given values of the other parameters. What's the best way to do this?

$\endgroup$
4
  • $\begingroup$ In this case, you could add the piecewise conditions as constraints on the optimisation $\endgroup$
    – mikado
    Commented Jul 1, 2020 at 6:00
  • 1
    $\begingroup$ Maximize[g[10, 1, 1, 5, 10, 0.24, ef], ef ] (*{0.698102, {ef -> 0.272076}}*) gets a little bit closer to the expected maximum. $\endgroup$ Commented Jul 1, 2020 at 6:13
  • $\begingroup$ Maximize[g[10, 1, 1, 5, 10, 24/100, ef] performs {217/288, {ef -> 6/25}}. $\endgroup$
    – user64494
    Commented Jul 1, 2020 at 8:10
  • $\begingroup$ @Bill: yes, it was a typo. Sorry about that and thanks for spotting it! I corrected it now. $\endgroup$
    – Lednacek
    Commented Jul 1, 2020 at 13:37

2 Answers 2

3
$\begingroup$
FullSimplify[g[10, 1, 1, 5, 10, 0.24, ef] // N]

Result

I believe these general min/maximize functions use search strategies that start with some initial points, and Mathematica doesn't expect that the max point is located at the isolated point $e_f=0.24$. Therefore, you may need to treat this specially.

Method 1

If[g[10, 1, 1, 5, 10, 0.24, 0.24] > #1,
   0.24, #2[[1, 2]]
   ] & @@ NMaximize[
  FullSimplify[g[10, 1, 1, 5, 10, 0.24, ef]], ef]
0.24
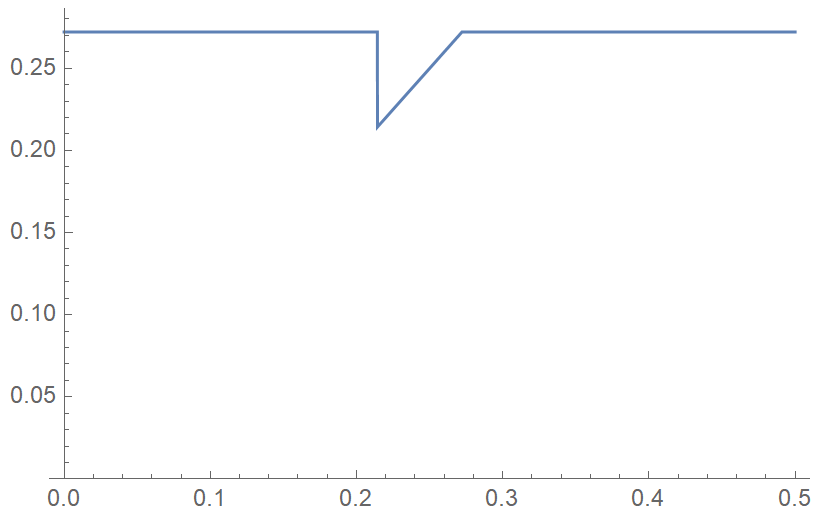
Plot[
 If[g[10, 1, 1, 5, 10, eh, eh] > #1,
    eh, #2[[1, 2]]
    ] & @@ NMaximize[
   FullSimplify[g[10, 1, 1, 5, 10, eh, ef]], ef],
 {eh, 0, 0.5}, PlotRange -> {0, Automatic}]

Plot

Method 2

Put the special data together with the result of NMaximize in same format, and then take the largest data according to the first element (value). This is more general.

MaximalBy[
  {
   {g[10, 1, 1, 5, 10, 0.24, 0.24], {ef -> 0.24}},
   NMaximize[FullSimplify@g[10, 1, 1, 5, 10, 0.24, ef], ef]
   },
  First
  ][[1, 2, 1, 2]]
0.24
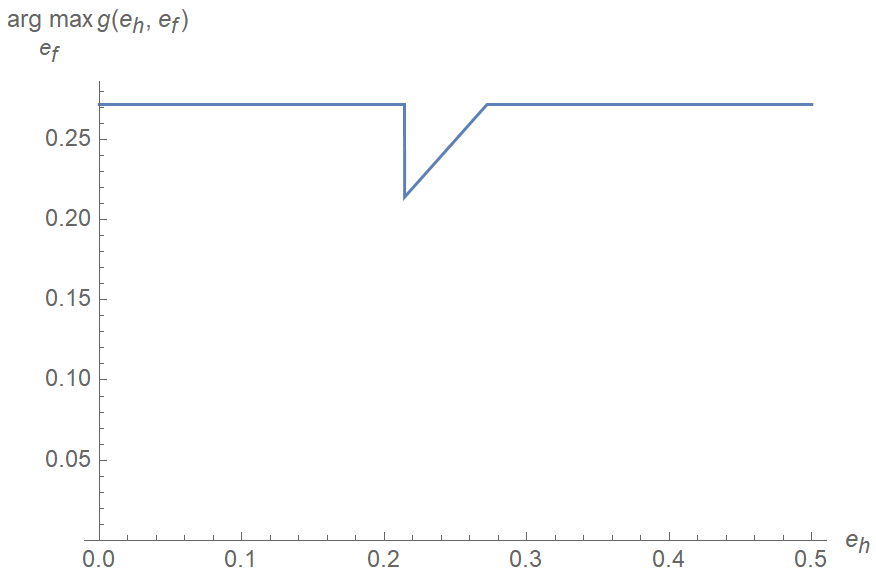
Plot[
 MaximalBy[
   {
    {g[10, 1, 1, 5, 10, eh, eh], {ef -> eh}},
    NMaximize[
     FullSimplify@g[10, 1, 1, 5, 10, eh, ef], ef]
    }, First
   ][[1, 2, 1, 2]],
 {eh, 0, 0.5},
 PlotRange -> {0, Automatic},
 AxesLabel -> {"\!\(\*SubscriptBox[\(e\), \(h\)]\)", 
\!\(\*UnderscriptBox[\("\<arg max\>"\), 
SubscriptBox[\(e\), \(f\)]]\) g[Subscript[e, h], Subscript[e, f]]}
 ]

Plot

$\endgroup$
6
  • $\begingroup$ Thank you! I see the difficulty of finding the isolated point. As I am not very advanced with Mathematica, just to understand what your code does: the #2 and #1 refer to the output of the NMaximize, right? #2[[1, 2]] is the value of the maximum? And #1 is the argmax? So for any eh in (0,0.6), if g[10, 1, 1, 5, 10, eh, eh] is greater than the maximum found through the NMaximize, the plot draws eh, otherwise it draws the argmax found through the NMaximize, is that correct? $\endgroup$
    – Lednacek
    Commented Jul 1, 2020 at 16:11
  • 1
    $\begingroup$ @Lednacek: Oops! The #1 and #2[[1,2]] were misplaced in my code. The plot is incorrect. I'll modify it later. As for what you say, they're right. $\endgroup$ Commented Jul 1, 2020 at 16:32
  • $\begingroup$ @Lednacek: I've updated my answer. $\endgroup$ Commented Jul 1, 2020 at 17:17
  • 1
    $\begingroup$ Thank you SO much! This is great! I have two more questions regarding your answer: (1) In the plot, where the curve drops vertically, I believe this should be a discontinuity (a jump). Why does it appear as a continuous (vertical) line? (2) Is there any way I can store the relationship plotted (the argmax of g(ef) as a function of eh) and use it for some later calculations? In particular, I need to calculate the intersection of the curve plotted with another function that links ef and eh. Many thanks again! $\endgroup$
    – Lednacek
    Commented Jul 1, 2020 at 21:31
  • 1
    $\begingroup$ @Lednacek: (1) I think it's because we're using functions that are non-differentiable to Mathematica like If and NMaximize, so the discontinuities are not detected. I can't think of a good solution but you can take a look at a related question: 10501. (2) Related question: 199037. $\endgroup$ Commented Jul 2, 2020 at 4:49
4
$\begingroup$

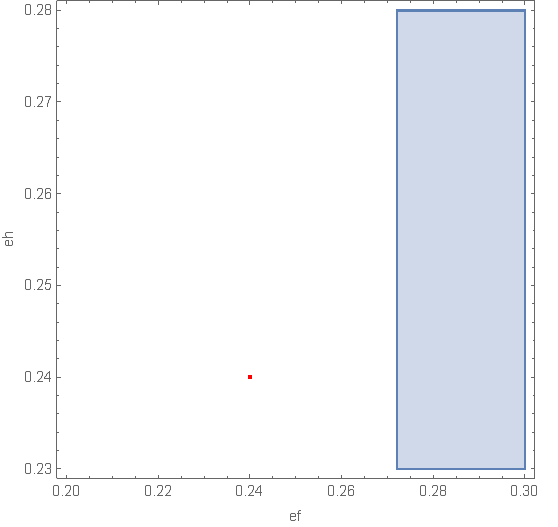
First consider the valid region of the parameters eh,ef

cond[a_?NumericQ, b_?NumericQ, c_?NumericQ, w_?NumericQ,F_?NumericQ ] := (ef == eh && ef > c/a) ||ef >= c/(a - 2 Sqrt[b] Sqrt[F]) 
RegionPlot[ cond[10, 1, 1, 5, 10] , {ef, .2, .3} , {eh, 0.23, .28},PlotPoints -> {100, {eh == ef}}, FrameLabel -> Automatic,Prolog -> {Red, Point[{.24, .24}]}]

enter image description here

The plot shows that the point ef==eh==.24 you expect the maximum isn't allowed!

NMaximize evaluates the maximum

Maximize[g[10, 1, 1, 5, 10, 0.24, ef], ef ]  (*{0.698102, {ef -> 0.272076}}*)

addendum

Obviously Mathematica didn't find the complete valid region. But Maximize is able to solve the problem if you add the constraints ef > 0, eh > 0 and maximize in two dimensions {ef,eh}:

Maximize[{g [10, 1, 1, 5, 10, eh, ef], ef > 0, eh > 0}, {ef, eh}] // N
(*{0.753847, {ef -> 0.242362, eh -> 0.242362}}*)

final addendum

If you are looking for a maximum for given parameters a, b, c, w, F, eh define a region depending on these parameters

reg[a_, b_, c_, w_, F_, eh_] =ImplicitRegion[(ef == eh && ef > c/a) ||ef >= c/(a - 2 Sqrt[b] Sqrt[F]), ef ]

and maximize

NMaximize[ g [10, 1, 1, 5, 10, .24, ef]  , Element[{ef}, reg [10, 1, 1, 5, 10, .24]]] 
(*{0.753472, {ef -> 0.24}}*)
$\endgroup$
10
  • 1
    $\begingroup$ How about g[10, 1, 1, 5, 10, 24/100, 24/100] which produces 217/288? See my comment to the question. $\endgroup$
    – user64494
    Commented Jul 1, 2020 at 13:27
  • $\begingroup$ @user64494 Yes, but the point eh=ef=.24 lies outside the valid region! $\endgroup$ Commented Jul 1, 2020 at 13:31
  • $\begingroup$ I am sorry but I don't see what is this "valid region"? The function g is defined for any positive ef. It is given by the expression in the first line when ef>c/(a - 2 Sqrt[b] Sqrt[F]) OR when ef>c/a AND ef=eh. (Otherwise, it is zero.) So eh=ef=.24>1/10 is a valid point and it corresponds indeed to the maximum that I would like to be able to find, but don't know how. $\endgroup$
    – Lednacek
    Commented Jul 1, 2020 at 13:55
  • $\begingroup$ Yes, that's the region plotted in my answer! $\endgroup$ Commented Jul 1, 2020 at 14:17
  • 1
    $\begingroup$ @Lednacek Perhaps my final addendum shows the way to solve your problem. $\endgroup$ Commented Jul 2, 2020 at 11:07

Your Answer

By clicking “Post Your Answer”, you agree to our terms of service and acknowledge you have read our privacy policy.

Not the answer you're looking for? Browse other questions tagged or ask your own question.