0
$\begingroup$

here it is my question. I have a system of two equations in two variables, so I can get a solution. The issue is that those equations depend on three parameters, so my solution will depend on their values. How can I make Mathematica evaluating the solution for different values of the parameters?

Example: I want so find the solution of the following:

NSolve[x == (3 k + 6 m - 3 y)/(6 t) && y == (k + 2 t - 3 x + m)/(3 t), {x, y}]

Trivially, the solution depends on the values of m, t and k. Let's say each of them may assume any value in the interval [0,1]. I have already used Manipulate, just to get an insight:

Manipulate[NSolve[x == (3 k + 6 m - 3 y)/(6 t) &&  y == (k + 2 t - 3 x + m)/(3 t), {x, y}], {m, 0, 1}, {t, 0.1, 1}, {k, 0, 1}]

Of course, this is not a final solution. How can I solve the problem? P.s. if necessary, I can fix the value of t equal to 1. If so, how can I create a plot or a table of all the results?

$\endgroup$

1 Answer 1

2
$\begingroup$

You can write a function that takes the parameters,

s[k_,m_,t_] = {x, y} /. Solve[
    x == (3 k + 6 m - 3 y)/(6 t) && 
    y == (k + 2 t - 3 x + m)/(3 t), {x, y}][[1]]

where the [[1]] just drops one layer of {curly braces} (which is safe since your equations are linear).

Then you can plug numbers in for k, m, t:

Outer[s,(*k:*)Subdivide[0, 1, 2],(*m:*)Subdivide[0, 1, 3],(*t:*) Subdivide[0, 1, 4]]

which gives a table of shape {3,4,5,2} (the last 2 is for the {x,y} pair. You can replace Subdivide with Range or whatever other function you like to generate numbers. You can also

Table[s[k, m, t], {k, 0, 1, 1/2}, {m, 0, 1, 1/3}, {t, 0, 1, 1/4}]

to get the same result.

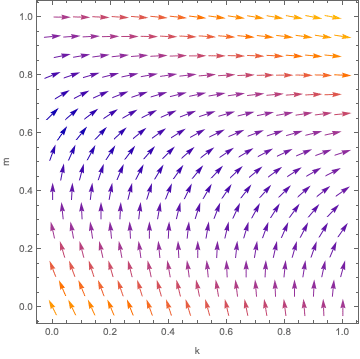
To plot at a fixed t you can do something like

witht[t_] :=  Flatten[Table[{{k, m}, s[k, m, t]}, 
                            {k, 0, 1, 0.01},
                            {m, 0, 1, 0.01}], 1]

ListVectorPlot[witht[1], FrameLabel -> {"k", "m"}]

which gives

2D stream plot

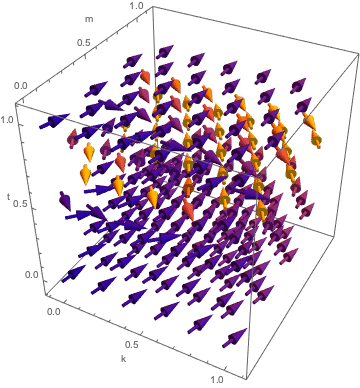
You can plot in 3D too,

vectors = Flatten[Table[{
    {k, m, t}, 
    s[k, m, t]~Join~{0}
    }, 
    {k, 0, 1, 0.1}, {m, 0, 1, 0.1}, {t, 0, 1, 0.1}], 2]

ListVectorPlot3D[vectors, AxesLabel -> {"k", "m", "t"}]

(I turned down the number of points. The ~Join~{0} is required because ListVectorPlot3D needs a 3D vector to plot.

3D vector plot

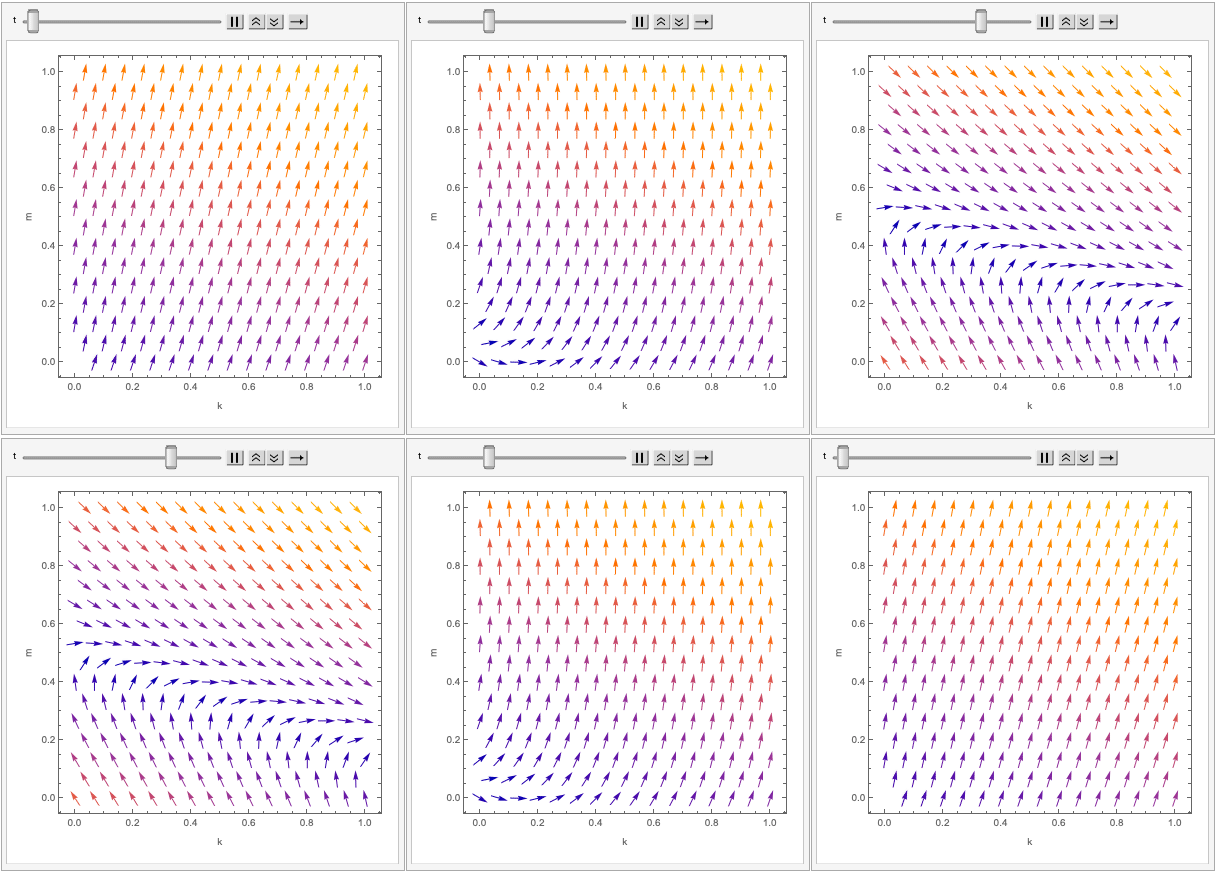
You can also animate the 2D plot, using Animate (which is like Manipulate),

Animate[ListVectorPlot[witht[t], FrameLabel -> {"k", "m"}], {t, 0, 1, 0.01}]

animation changing t

$\endgroup$
13
  • $\begingroup$ As far as plotting goes... you have a 3-dimensional input space and a 2-dimensional output, so how to plot is not obvious. $\endgroup$
    – evanb
    Commented Apr 21, 2020 at 16:07
  • $\begingroup$ Wow, that is a very good answer! Thanks a lot. $\endgroup$ Commented Apr 21, 2020 at 17:57
  • $\begingroup$ Sure! Feel free to give it an upvote. After a day or two you can "Accept" the most helpful answer---waiting some time lets other people respond too. $\endgroup$
    – evanb
    Commented Apr 21, 2020 at 18:00
  • $\begingroup$ Of course I have already upvoted, just my reputation is too low so it is not shown. Just to be sure, basically this code firstly creates a function called s which runs the command Solve for given values of k, m and t, right? From that part, I just don't understand this -> {x, y} /. and [[1]] (also, my bad, my functions are not linear like the ones in the example I set). $\endgroup$ Commented Apr 21, 2020 at 18:04
  • $\begingroup$ Also, the Outer runs the function s for different combinations of k, m and t. There, I don't understand the division by 2, 3 and 4, and I do not get the meaning of the structure of the list. If it is possible, I would like to get a table giving me the final solution together with the values of the parameters that generate that solution. $\endgroup$ Commented Apr 21, 2020 at 18:04

Your Answer

By clicking “Post Your Answer”, you agree to our terms of service and acknowledge you have read our privacy policy.

Not the answer you're looking for? Browse other questions tagged or ask your own question.