3
$\begingroup$

I plot curves by

ContourPlot[x^2 y + x y^2 == 1, {x, -10, 10}, {y, -10, 10}]

It shows three curves on the (x,y) plane, but now my question is how to iterate all the points on the curves, the iterative equation is complex (nonlinear), for example, x = x+y*x, and y = x*y+y^2.

I have an idea, solve x^2 y + x y^2 == 1 and get (x,y), then plot it by ParametricPlot one by one, but it will be tedious (as it is nonlinear, so solve it is difficult sometimes). Is there any better way?

$\endgroup$
0

2 Answers 2

2
$\begingroup$

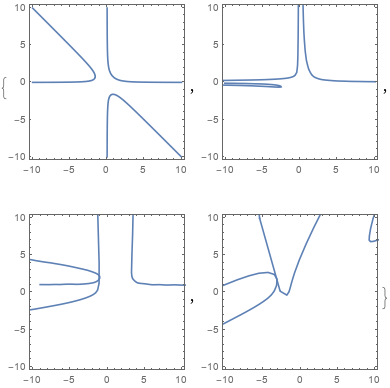
Update: An alternative approach using BSplineFunction:

ClearAll[tr, iter]

tr = {# + #2 #, # #2 + #2^2} & @@@ # &;

iter = Normal[#] /. Line -> (Line[tr[BSplineFunction[#] /@ Subdivide[50]]] &) &;

Examples:

cp = ContourPlot[x^2 y + x y^2 == 1, {x, -10, 10}, {y, -10, 10}];

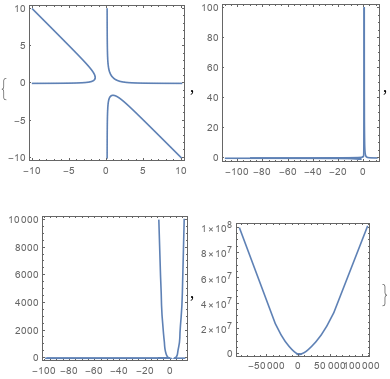
NestList[iter, cp, 3]

enter image description here

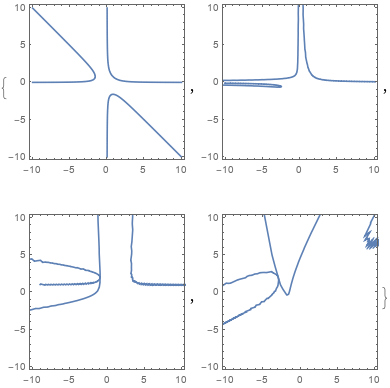
NestList[Show[iter @ #, PlotRange -> All] &, cp, 3]

enter image description here

Original answer:

ClearAll[tr, iterate]

tr = {# + #2 #, # #2 + #2^2} & @@@ # &;
iterate = MapAt[tr, #, {1, 1, 1}] &;

Examples:

cp = ContourPlot[x^2 y + x y^2 == 1, {x, -10, 10}, {y, -10, 10}];

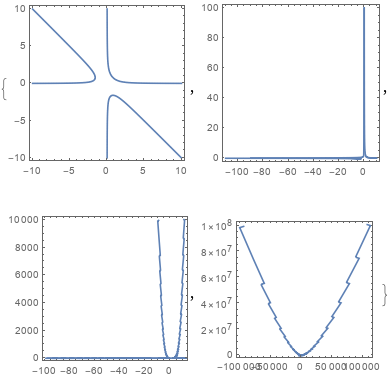
NestList[iterate, cp, 3]

enter image description here

NestList[Show[iterate @ #, PlotRange -> All] &, cp, 3]

enter image description here

Note: In version 11.3 replace {1, 1, 1} with {1, 1} in MapAt[...].

$\endgroup$
3
  • $\begingroup$ Very interesting! Trying to reproduce your results I get message Plus is not a Graphics primitive or directive. ? $\endgroup$ Commented Apr 16, 2020 at 7:44
  • $\begingroup$ @UlrichNeumann, in v12.1 we need {1,1,1} in the last argument of MapAt to get the coordinates of GraphicsComplex. In version 11.3 {1,1} works, $\endgroup$
    – kglr
    Commented Apr 16, 2020 at 8:10
  • $\begingroup$ How simple, thanks! $\endgroup$ Commented Apr 16, 2020 at 8:28
1
$\begingroup$
Clear["Global`*"]

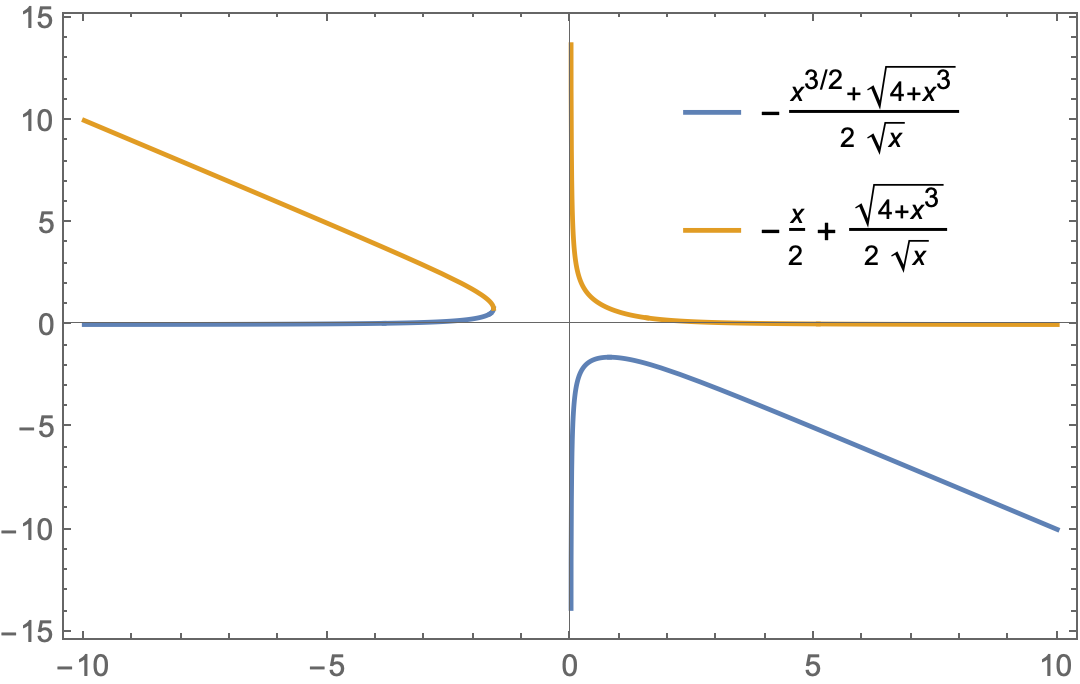
There are two solutions

sol = Solve[x^2 y + x y^2 == 1, y] // Simplify

(* {{y -> -((x^(3/2) + Sqrt[4 + x^3])/(2 Sqrt[x]))}, {y -> -(x/2) + Sqrt[
    4 + x^3]/(2 Sqrt[x])}} *)

Plot[Evaluate[y /. sol], {x, -10, 10},
 Frame -> True,
 PlotLegends -> Placed["Expressions", {.75, .75}]]

enter image description here

$\endgroup$

Your Answer

By clicking “Post Your Answer”, you agree to our terms of service and acknowledge you have read our privacy policy.

Not the answer you're looking for? Browse other questions tagged or ask your own question.