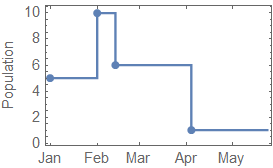
I have list of rules from where a DateListStepPlot can be created to visualize the problem:
dateToPopulationRules = {DateObject[{2019, 1, 1}] -> 5, DateObject[{2019, 2, 1}] -> 10, DateObject[{2019, 2, 13}] -> 6, DateObject[{2019, 4, 4}] -> 1};
DateListStepPlot[List @@@ dateToPopulationRules, PlotMarkers -> Automatic, FrameLabel -> {None, "Population"}]
I want to create an efficient function for population using a huge instance of dateToPopulationRules. Here's my poor implementation:
Clear[population];
population[dateObj_] := 0;
Table[
  With[{dateLim = First@dpr, pop = Last@dpr},
   population[dateObj_] := Condition[pop, dateObj >= dateLim]
   ]
  , {dpr, dateToPopulationRules}];
An example showing how the population function works is below. You may want to see DownValues@population in case that helps understanding my code.
In[11]:= population[DateObject[{2019, 3, 1}]]
Out[11]= 5
Although this approach is effective I don't think is the most efficient. I would like to see another solution using a Nearest function or other function that can handle large data sets efficiently.


AbsoluteTime. Simple numbers will beat date objects in performance most of the time. You can useInterpolation[data, InterpolationOrder -> 0]to get the interpolation behavior you're looking for. $\endgroup$