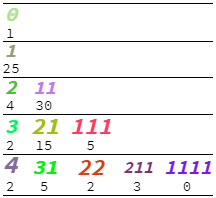
I want to create a report from two matrices m1 and m2 (already created, and available) with data.
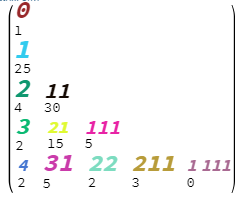
The report should (roughly) look like the output of the following code:
ClearAll[sa];
sa = SparseArray[Table["", 5, 5]];
sa[[1, 1]] = "0\n1" ;
sa[[2, 1]] = "1\n25";
sa[[3, 1]] = "2\n4";
sa[[3, 2]] = "11\n30";
sa[[4, 1]] = "3\n2";
sa[[4, 2]] = "21\n15";
sa[[4, 3]] = "111\n5";
sa[[5, 1]] = "4\n2";
sa[[5, 2]] = "31\n5";
sa[[5, 3]] = "22\n2";
sa[[5, 4]] = "211\n3";
sa[[5, 5]] = "1111\n0";
sa // MatrixForm
The data before the newline ( \n ) comes from the first matrix m1, the data after the newline comes from the second matrix m1.
In fact m1 contains textual headings for the data in m2.
My question is in fact, given a matrix containing only data like, for example:
ClearAll[sa];
sa = SparseArray[Table["", 5, 5]];
sa[[1, 1]] = 1 ;
sa[[2, 1]] = 25;
sa[[3, 1]] = 4;
sa[[3, 2]] = 30;
sa[[4, 1]] = 2;
sa[[4, 2]] = 15;
sa[[4, 3]] = 5;
sa[[5, 1]] = 2;
sa[[5, 2]] = 5;
sa[[5, 3]] = 2;
sa[[5, 4]] = 3;
sa[[5, 5]] = 0;
sa // MatrixForm
Then, what is the best strategy to decorate the cell elements with all sorts of textual attributes, color, etc., and in my case a textual heading?
Note that the data and the data for the cell heading texts are initially stored in two matrices and that I am best helped with a general strategy to decorate data in a matrix for reporting purposes.
Finally, what is the best function to produce the report?


OptionsofGrid? What functionality do you need that is missing? $\endgroup$