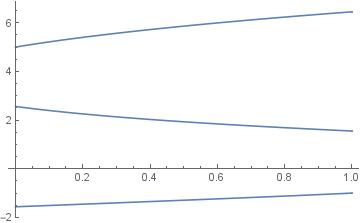
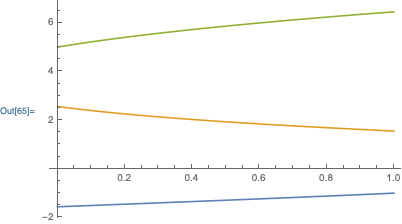
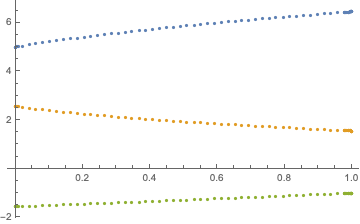
I want to extract data of these plots
There are many ways to extract data from plots (if you search you'll find good examples).
One method I like is EvaluationMonitor since one can then control what data to extract, and how to format it, even thought it might not be the most efficient?
ClearAll[m, c, x]
m[c_] := {{1, -c + 1, 2}, {c, 5, c}, {2, 5, c}};
data = Reap@
   Plot[Eigenvalues[m[c]], {c, 0, 1},
     EvaluationMonitor :> Sow[{c, Eigenvalues[m[c]]}]];
data = data[[2, 1]]
And now data contains what you want
 {{2.04082*10^-8, {5., 2.56155, -1.56155}},
  {0.0196287, {5.04462, 2.52608, -1.55108}},
  {0.0409084, {5.09137, 2.48926, -1.53972}},
  ....
The first value in each row is c and the second list in each row are the eigenvalues for that c.
For example
Eigenvalues[m[0.0196286612015304`]]
Gives
{5.04462, 2.52608, -1.55108}
Which you see is the second row in the output. etc..
The above is basically the same as doing
Table[{c, Eigenvalues[m[c]]},{c,0,...}]
The only difference is that you are using Plot choice of the sample values of c it used to make the plot, which one does not know before hand.
Update
It is not possible to plot data of each line
All the data is there. One way to plot it from the extracted data is
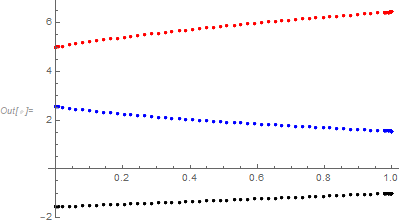
p1 = ListPlot[Transpose[{data[[All, 1]], data[[All, 2, 1]]}], PlotStyle -> Red];
p2 = ListPlot[Transpose[{data[[All, 1]], data[[All, 2, 2]]}], PlotStyle -> Blue];
p3 = ListPlot[Transpose[{data[[All, 1]], data[[All, 2, 3]]}], PlotStyle -> Black];
Show[{p1, p2, p3}, AxesOrigin -> {0, 0}, PlotRange -> All]

There is probably a better way to plot the data back, but this becomes a question on plotting. The point is, all the data is there.


