0
$\begingroup$

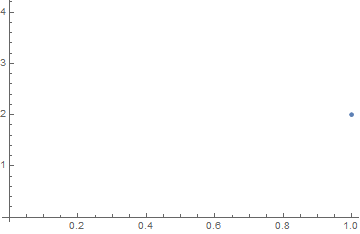
Why does the following output from a Sow/Reap not plot?

{out, pts} = Reap[
...
EvaluationMonitor :> Sow[{p}]]`

{{{-50}, {2}, {0}, {-50}, {2}, {0}, {2}, 
{-50}, {0}, {2}, {0}, {2}, {0}, {0}, {0}, {0}, {0}, {0}, {0}, {2}, \
{2}, {0}, {0}, {2}, {4}, {0}, {0}, {0}, {0}, {0}, {0}, {0}, {0}, {0}, \
{0}, {0}, {0}, {4}, {0}, {2}, {0}, {0}, {0}, {2}, {0}, {0}, {0}, {0}, \
{2}, {0}, {0}, {0}, {0}, {0}, {0}, {2}, {0}, {0}, {0}, {0}, {0}, {0}, \
{0}, {0}, {0}, {0}, {-50}, {0}, {0}, {0}, {0}, {2}, {0}, {0}, {0}, \
{0}, {0}, {0}, {0}, {2}, {2}, {2}, {2}, {2}, {2}}}

ListPlot[{p}]

enter image description here

$\endgroup$
1
  • $\begingroup$ Why all the curly braces? Just Sow[p] and then ListPlot[pts]. $\endgroup$
    – Roman
    Commented Jun 3, 2019 at 17:02

1 Answer 1

1
$\begingroup$

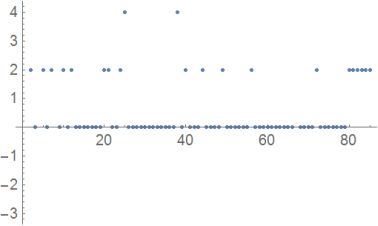
Try

ListPlot[p // Flatten]

enter image description here

to plot the values over indices

$\endgroup$
2
  • $\begingroup$ That works, but why doesn't it show the -50? $\endgroup$
    – spaced
    Commented Jun 3, 2019 at 17:25
  • $\begingroup$ Just add , PlotRange -> All $\endgroup$ Commented Jun 3, 2019 at 17:28

Your Answer

By clicking “Post Your Answer”, you agree to our terms of service and acknowledge you have read our privacy policy.

Not the answer you're looking for? Browse other questions tagged or ask your own question.