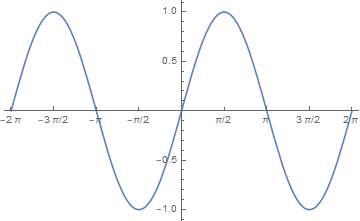
I want to set the fractional tick lables in linear form like this:

And it can be done by use Row in each label, but it's boring.
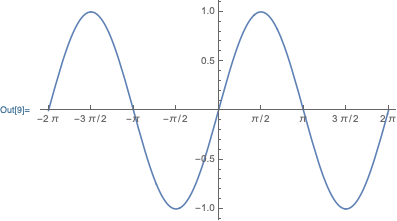
Plot[Sin[x], {x, -2 \[Pi], 2 \[Pi]},
 Ticks ->
    {{
     {-2\[Pi],-2\[Pi]},
     {-((3 \[Pi])/2),Row[{-3 \[Pi], "/", 2}]},
     {-\[Pi], -\[Pi]},
     {-(\[Pi]/2),Row[{-\[Pi], "/", 2}]},
     {0, 0},
     {\[Pi]/2,Row[{\[Pi], "/", 2}]},
     {\[Pi], \[Pi]},
     {(3 \[Pi])/2,Row[{3 \[Pi], "/", 2}]},
     {2 \[Pi], 2 \[Pi]}
     },
     Automatic}
]
In this question Michael E2's answer, One can use Style and FractionBoxOptions to set Beveled.
Is there a similar option to set linear fractional tick labels?


