I have the following code below:
num = 25;
U[x_] := 50*(Sech[1.5*(x - 5.8)])^4 - 0.14*(Sech[0.5*(x - 6.5)])^2
V[x_] := U[x] - U[3.8]
Plot[V[x], {x, 0, 4.75}, PlotRange -> All];
A := 1.05459^2*0.01/2/1.6726/1.60219
{vals, funs} =
NDEigensystem[-(A/x)*D[x*D[\[Psi][x], {x}], {x}] +
V[x]*\[Psi][x], \[Psi][x], {x, 0, 5}, num];
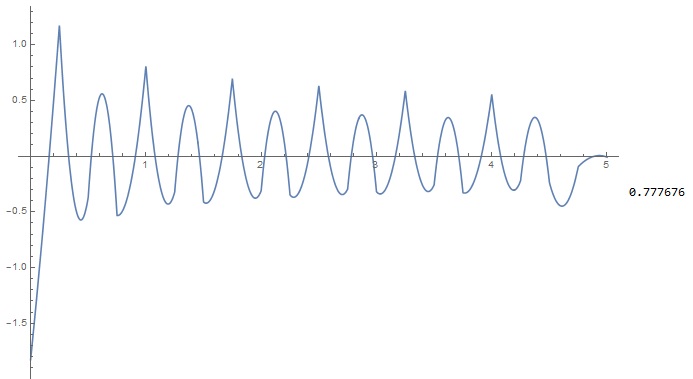
And I get the following graphic:
Here, as I expect there should not be such a sharp peak at the beginning of the plot. So I tried to increase a number of points for the plot:
Plot[Evaluate[funs[[25]]/
Sqrt[NIntegrate[x*(funs[[25]])^2, {x, 0, 5},
AccuracyGoal -> 10]]], {x, 0, 5}, PlotLegends -> vals[[25]],
PlotRange -> All]
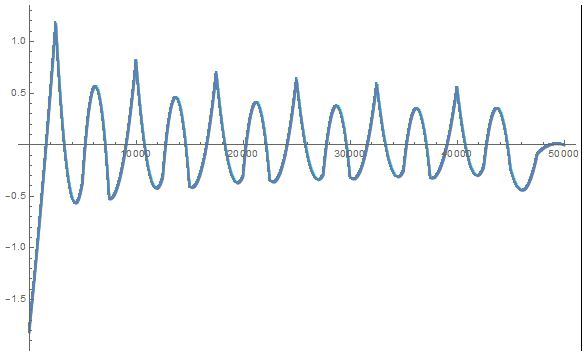
And get the following:
It's the same graph, but in different ranges. How can I do the same, but in range from 0 to 5?


Plot. The interpolating function that you are using (funs[[25]]) already has this shape. $\endgroup$