Given two functions x[T],y[T]
x[T_] := (100000 T)/(47 Log[18/(-7 + 25 Abs[Cos[100 \[Pi] T]])])
y[T_] := 100 (-(7/500) + (7 T)/5 - (5 T (-1 + Abs[Cos[100 \[Pi] T]]))/Log[18/(-7 + 25 Abs[Cos[100 \[Pi] T]])] + Sin[100 \[Pi] T]/(20 \[Pi]))
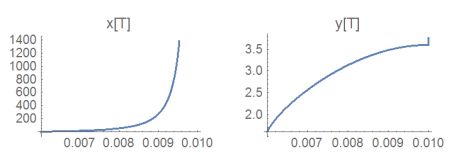
the plot is easily created
Plot[{x[u], y[u]}, {u, .006, .01}]
If I try ParametricPlot (with adjusted PlotRange and AspectRatio) I get an empty plot
ParametricPlot[{x[u], y[u]}, {u, .006, .01},PlotRange -> {{0, 1500}, {0, 5}}, AspectRatio -> 1]
Any suggestions? Thanks!
remark:
Meanwhile I found a workaround by decreasing the plotintervall:
ParametricPlot[ {x[u], y[u]} , {u, .006, .01 - .001},AspectRatio -> 1]
Knowing that u==0.01is Indeterminate unfortunately I can't exclude it:
ParametricPlot[ {x[u], y[u]} , {u, .006, .01 },AspectRatio ->1,Exclusions->{0.01}]


