1
$\begingroup$

I am trying to fit a 2 dimensional function. For that, I am using the function NonlinearModelFit. The model is

model = (a1[1, 0] - 3 x a1[2, 1] - 3/2 (x^2 + y^2) a1[3, 0] + 
15 x^2 a1[3, 2] - 3 y (5 y a1[3, 2] + b1[2, 1]) + 
30 x y b1[3, 2])^2 + 
1/4 (2 y (a1[2, 0] + 6 a1[2, 2] - 3 x (a1[3, 1] + 30 a1[3, 3])) + 
2 b1[1, 1] - 3 x (4 b1[2, 2] + x (b1[3, 1] - 30 b1[3, 3])) - 
9 y^2 (b1[3, 1] + 10 b1[3, 3]))^2 + (a1[1, 1] - 
9/2 x^2 (a1[3, 1] - 10 a1[3, 3]) - 
3/2 y (y a1[3, 1] + 30 y a1[3, 3] + 4 b1[2, 2]) + 
x (a1[2, 0] - 6 a1[2, 2] - 3 y b1[3, 1] + 90 y b1[3, 3]))^2

where a1[i,j] and b1[i,j] are the variables.

I am getting 10000 points for the fit from the function I want my model to be approximated to (just my free choice) in the form data={{x1,y1,f[x1,y1]},{x2,y2,f[x2,y2]},...}.

For the initial conditions,

InitialConditions = 
Table[{Variables[model /. {x -> 1, y -> 1}][[i]], 1*^-6}, {i, 1, 
Length[Variables[model /. {x -> 1, y -> 1}]]}]

And finally,

data = Import["https://pastebin.com/raw/wMLHJX9m", "Package"];
NonlinearModelFit[
data, {model, 
k - 1*^-6 < Abs[b1[1, 1]] < k + 1*^-6, -1*^-6 < Abs[a1[1, 0]] < 
1*^-6, -1*^-6 < Abs[a1[1, 1]] < 1*^-6}, InitialConditions, {x, y},
MaxIterations -> 10000, WorkingPrecision -> 9, 
Method -> {NMinimize, 
Method -> {"DifferentialEvolution", "ScalingFactor" -> 0.9, 
  "CrossProbability" -> 0.1, 
  "PostProcess" -> {FindMinimum, Method -> "QuasiNewton"}}}]

There is no reason for the choice of parameters, method and working precision that I am using, I have been trying different things and follow different examples.

The problem is that I am not getting good results. The behavior of the model function for the best fit parameters is not similar to the expected one at all. Also, each time I run the function, it takes around 20 min, so it is very difficult to try different parameters and method to compare.

I think that the problem might be that the function I want to approximate has the form $f(x,y)=f_0+h(x,y)$ with $h(x,y)$ of the order of $10^{-6}$ and $f_0 \approx 1$

EDIT:

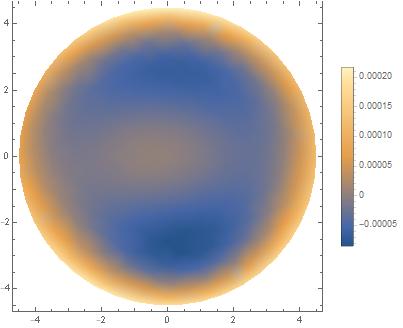
enter image description here

This is a DensityPlot of my model with the fit parameters minus the exact function. As you can see, the functions don't even have the same behavior. I would also like to decrease this difference.

$\endgroup$
6
  • 2
    $\begingroup$ "The problem is that I am not getting good results." What exactly does this mean? Are you disappointed in the fit? Are there errors or warnings? Maybe it's simply that the model can't provide a good fit the data and has nothing to do with NonlinearModelFit. Sharing at least a sample of your data is necessary to provide any help. $\endgroup$
    – JimB
    Commented Apr 12, 2018 at 22:08
  • $\begingroup$ I added one plot of the difference between the plots. There are no warning or error messages, just a disappointing and slow solution. $\endgroup$
    – Psyphy
    Commented Apr 12, 2018 at 22:35
  • 1
    $\begingroup$ A subset of your data would be best but if you can't share any of your data, can you share the estimates of the parameters including the minimum and maximum of the predictor variables? I ask because that way I can generate data to examine the fit of the model to that set of data. But if you aren't getting errors or warnings, then it might very well be that you model just won't fit the data. $\endgroup$
    – JimB
    Commented Apr 13, 2018 at 0:25
  • $\begingroup$ On that note: please post (a small subset of) your data on Pastebin and link to it here. Your question looks to be unanswerable without it. $\endgroup$ Commented Apr 13, 2018 at 2:19
  • $\begingroup$ pastebin.com/7DNgguqN Here is a small subset. As you can see, the variations of the function are very small. $\endgroup$
    – Psyphy
    Commented Apr 13, 2018 at 2:30

1 Answer 1

2
$\begingroup$

I think that if you subtract the minimum $y$ value and then multiply by 10^9 and remove all of the parameter restrictions, you'll get a good fit.

model = (a1[1, 0] - 3 x a1[2, 1] - 3/2 (x^2 + y^2) a1[3, 0] + 
      15 x^2 a1[3, 2] - 3 y (5 y a1[3, 2] + b1[2, 1]) + 
      30 x y b1[3, 2])^2 + 
   1/4 (2 y (a1[2, 0] + 6 a1[2, 2] - 3 x (a1[3, 1] + 30 a1[3, 3])) + 
       2 b1[1, 1] - 3 x (4 b1[2, 2] + x (b1[3, 1] - 30 b1[3, 3])) - 
       9 y^2 (b1[3, 1] + 10 b1[3, 3]))^2 + (a1[1, 1] - 
      9/2 x^2 (a1[3, 1] - 10 a1[3, 3]) - 
      3/2 y (y a1[3, 1] + 30 y a1[3, 3] + 4 b1[2, 2]) + 
      x (a1[2, 0] - 6 a1[2, 2] - 3 y b1[3, 1] + 90 y b1[3, 3]))^2;

InitialConditions = 
  Table[{Variables[model /. {x -> 1, y -> 1}][[i]], 1*^-6}, {i, 1, 
    Length[Variables[model /. {x -> 1, y -> 1}]]}];

data = Import["https://pastebin.com/raw/wMLHJX9m", "Package"];
data2 = data;
data2[[All, 3]] = ((data[[All, 3]] - Min[data[[All, 3]]]))*10^9;
nlm = NonlinearModelFit[data2, model, InitialConditions, {x, y}];
nlm["BestFitParameters"]

(* {a1[1, 0] -> -0.219553, a1[2, 1] -> -16.0184, a1[3, 0] -> 72.2813, 
 a1[3, 2] -> -56.9915, b1[2, 1] -> 1.85967, b1[3, 2] -> 3.48335, 
 a1[1, 1] -> 0.428318, a1[2, 0] -> 32.548, a1[2, 2] -> 7.37364, 
 a1[3, 1] -> -51.3845, a1[3, 3] -> -3.57784, b1[2, 2] -> 1.918, 
 b1[3, 1] -> 183.339, b1[3, 3] -> 17.3889, b1[1, 1] -> -0.361997} *)

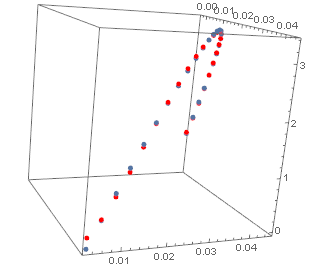
Show[ListPointPlot3D[data2, PlotStyle -> PointSize[0.02], 
  BoxRatios -> {1, 1, 1}],
 ListPointPlot3D[
  Transpose[{data[[All, 1]], data[[All, 2]], 
    nlm["PredictedResponse"]}], PlotStyle -> {Red, PointSize[0.02]}]]

Fitted and actual 3d data plot

$\endgroup$
5
  • $\begingroup$ Huh, so it was a matter of bad scaling... :D Maybe the OP should have picked better units for his measurements. $\endgroup$ Commented Apr 13, 2018 at 5:07
  • $\begingroup$ @J.M. It sure seems that way. I guess the test will be if things work with the complete dataset. Non-convergence (or convergence to the wrong solution) because of scaling issues is pretty common but not always recognized. $\endgroup$
    – JimB
    Commented Apr 13, 2018 at 5:20
  • 1
    $\begingroup$ @Psyphy Obviously you'll need to check out this approach with the full dataset. But when you do you might want to run the following command: nlm["CorrelationMatrix"]//MatrixForm. If there are lots of values close to -1 and +1, then it is likely that the model is way over-parameterized. (It certainly is overparameterized with just the 26 data points supplied to estimate 16 parameters: 15 coefficients and 1 error variance.) $\endgroup$
    – JimB
    Commented Apr 13, 2018 at 5:31
  • $\begingroup$ Thanks for the answer. However, I forgot to mention that the restrictions are very important, $b1[1,1]$ has to be more or less equal to $k$. Let´s suppose that $k=1.45$. $\endgroup$
    – Psyphy
    Commented Apr 13, 2018 at 16:20
  • $\begingroup$ You'll need to see how that works with the full dataset. With just the 26 data points the model is overparameterized, a1[1,0] and a1[1,1] are estimated to be essentially zero, and all of the correlations among the parameter estimates are either -1 of +1. If a bad/undesired fit is then found, that means the model doesn't fit the data and you'll need to figure out the guilty party: data or model. But NonlinearModelFit is innocent in this case. $\endgroup$
    – JimB
    Commented Apr 13, 2018 at 16:53

Your Answer

By clicking “Post Your Answer”, you agree to our terms of service and acknowledge you have read our privacy policy.

Not the answer you're looking for? Browse other questions tagged or ask your own question.