1
$\begingroup$

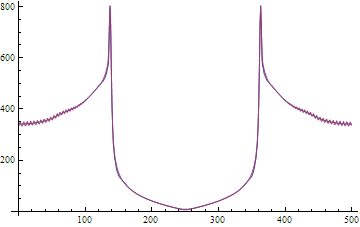
I have a data (see this link) which has some wiggles at both end.

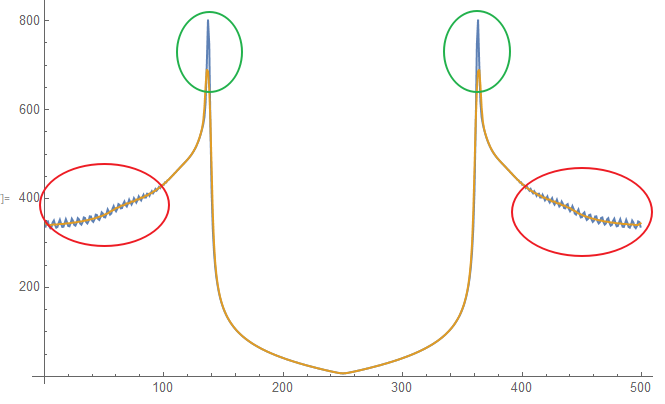
I tried to apply different filters to smooth the data, like this

ListLinePlot[{data, MeanFilter[data, 2]}]

enter image description here

The wiggles are perfectly smooth. However, the problem is that the main peak is also severely drop down(show in green circle) which is not what I want. I also tried other filter like LowpassFilter, GaussianFilter, all suffers this problem.

So how to remove small wiggles and preserve main peak of a data? Splitting data to piecewise may not be a good idea, because I have dozens of data to smooth, their main peaks are not at the same locations.

$\endgroup$
1
  • 1
    $\begingroup$ It is clear, that you will have certain decrease of your function values when some high-freq Fourier components removed. I guess you can re-normalize you function using the ratio of areas under the curve before and after filtering. It can be like this: newF[x]=(Integrate[F[x],{x,a,b}]/Integrate[filteredF[x],{x,a,b}])*filteredF[x] $\endgroup$
    – Rom38
    Commented Apr 3, 2018 at 5:24

1 Answer 1

2
$\begingroup$

You need a nonlinear filter like MeanShiftFilter to do that. MeanShiftFilter asks for a radius and a threshold, which have to be set according to the noise in your data. MeanShiftFilter[data, 10, 50] gives this result:

MeanShiftFilter

The peak value is preserved:

Max /@ {MeanShiftFilter[data, 10, 50], data}
{802.993, 802.993}
$\endgroup$

Your Answer

By clicking “Post Your Answer”, you agree to our terms of service and acknowledge you have read our privacy policy.

Not the answer you're looking for? Browse other questions tagged or ask your own question.