0
$\begingroup$

I need to solve these coupled equations and plot the results as a function of CapitalGamma I tried to simplify all equations by using "Rationalize", as I found here for a similar problem, but I got nothing after long time of running. Could you please tell me what is the problem?!

s = Solve[{-0.264*^-6 \[Rho]12 - 
   I \[CapitalGamma] \[Rho]12 - (0.784615 + 
      13.983590 I) (-\[Rho]11 + \[Rho]22) - (4.511891*^-7 + 
      7.999390*^-6 I) \[Rho]12 (-\[Rho]11 + \[Rho]22) + (0.041176 \+ 0.729593 I) \[Rho]32 - (1.252607*^-7 + 
      2.219759*^-6 I) \[Rho]13 \[Rho]32 == 
  0 && -0.264*^-6 \[Rho]21 + 
   I \[CapitalGamma] \[Rho]21 - (0.784615 - 
      13.983590 I) (-\[Rho]11 + \[Rho]22) + (4.511891*^-7 + 
      7.999390*^-6 I) \[Rho]21 (-\[Rho]11 + \[Rho]22) + (0.041176 \- 0.729593 I) \[Rho]23 - (1.252607*^-7 - 
      2.219759*^-6 I) \[Rho]23 \[Rho]31 == 
  0 && -3.036*^-7 \[Rho]13 - (0.784615 + 
      13.983590 I) \[Rho]23 - (4.511891*^-7 + 
      7.999390*^-6 I) \[Rho]12 \[Rho]23 + (0.041176 + 
      0.729593 I) (-\[Rho]11 + \[Rho]33) - (1.252607*^-7 + 
      2.219759*^-6 I) \[Rho]13 (-\[Rho]11 + \[Rho]33) == 
  0 && -3.036*^-7 \[Rho]31 - (0.784615 - 
      13.983590 I) \[Rho]32 - (4.511891*^-7 - 
      7.999390*^-6 I) \[Rho]21 \[Rho]32 + (0.041176 - 
      0.729593 I) (-\[Rho]11 + \[Rho]33) - (1.252607*^-7 - 
      2.219759*^-6 I) \[Rho]31 (-\[Rho]11 + \[Rho]33) == 
  0 && (-0.0411768 + 0.729593 I) \[Rho]12 + (0.784615 + 
      13.983590 I) \[Rho]31 + (5.764498*^-7 + 
      5.779630*^-6 I) \[Rho]12 \[Rho]31 + (-3.96*^-8 - 
      I \[CapitalGamma]) \[Rho]32 == 
  0 && (0.784615 - 13.983590 I) \[Rho]13 - (0.041176 + 
      0.729593 I) \[Rho]21 + (5.764498*^-7 - 
      5.779630*^-6 I) \[Rho]13 \[Rho]21 + (-3.96*^-8 + 
      I \[CapitalGamma]) \[Rho]23 == 
  0 && -0.0528*^-5 \[Rho]11 - (0.784615 - 
      13.983590 I) \[Rho]12 + (0.0411768 - 
      0.729593 I) \[Rho]13 - (0.784615 + 13.983590 I) \[Rho]21 - 
   9.023782*^-7 \[Rho]12 \[Rho]21 + (0.0411768 + 
      0.729593 I) \[Rho]31 - (5.764498*^-7 + 
      5.779630*^-6 I) \[Rho]13 \[Rho]31 == 
  0 && -0.264*^-6 \[Rho]11 + (0.7846153 - 
      13.983590 I) \[Rho]12 + (0.7846153 + 
      13.983590 I) \[Rho]21 + 9.0237826*^-7 \[Rho]12 \[Rho]21 + 
   0.792*^-7 \[Rho]33 == 0 && (-0.041176 + 0.729593 I) \[Rho]13 - (0.0411768 + 0.7295932 I) \[Rho]31 + 2.505214*^-7 \[Rho]13 \[Rho]31 + 
   6.6*^-16 (400000000 \[Rho]11 - 120000000 \[Rho]33) == 
  0}, {\[Rho]12, \[Rho]13, \[Rho]31, \[Rho]21, \[Rho]11, \\[Rho]22, \[Rho]33, \[Rho]23, \[Rho]32}];Plot[\[Rho]12 /. s[[1]], {\[CapitalGamma], 0, 0.1}]
$\endgroup$
3
  • $\begingroup$ If one sets $\Gamma=0.5$ and then uses NSolve, all but one of the solutions for $\rho12$ are complex. The one non-complex solution has $\rho12=0$. $\endgroup$
    – JimB
    Commented Sep 2, 2017 at 6:39
  • $\begingroup$ Thank you for your response. I tried to do that. You are right, Rho 12 is complex. But I want to plot Rho12 at different values of Gamma. $\endgroup$ Commented Sep 2, 2017 at 6:51
  • $\begingroup$ The problem is to find the solution (s). The running takes very long time and no output is obtained.. $\endgroup$ Commented Sep 2, 2017 at 7:01

1 Answer 1

2
$\begingroup$

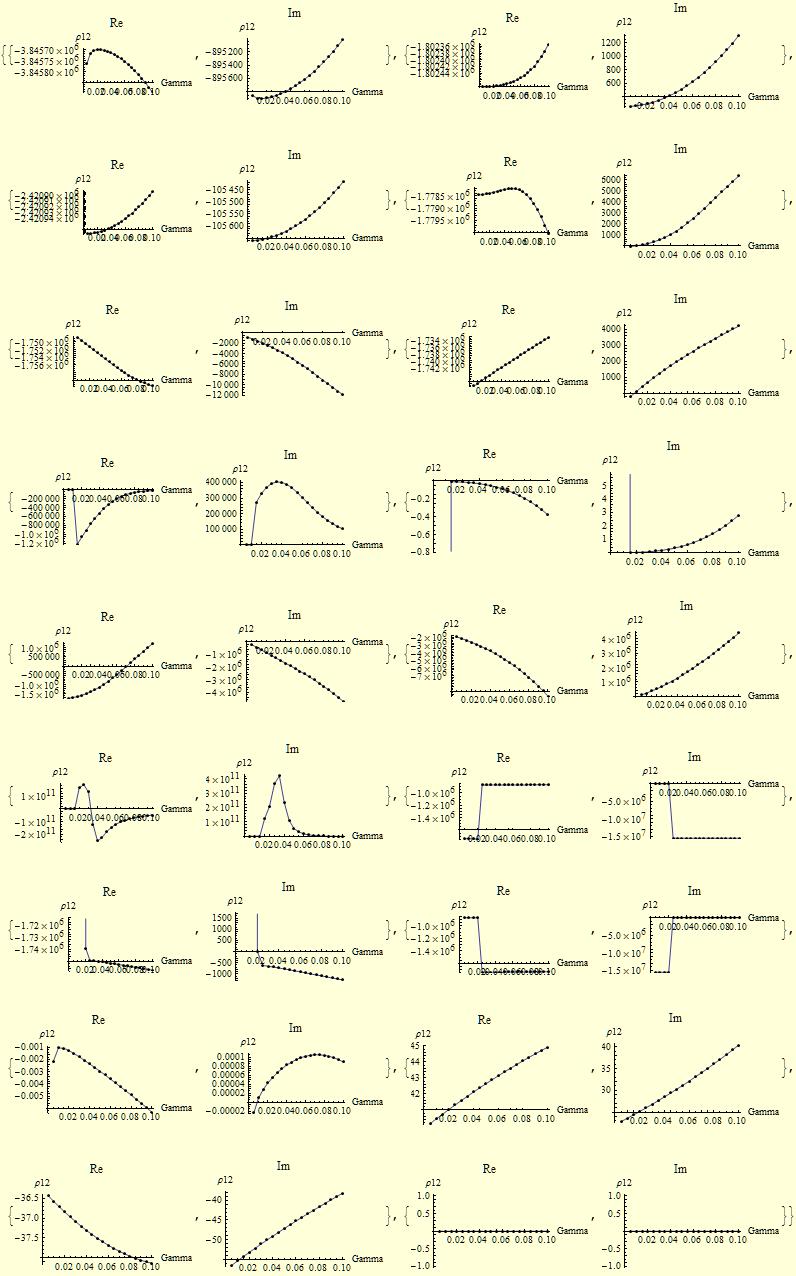
If Solve can't do the job or it takes to long, do it with NSolve, generate a list for certain values of Gamma and print it with ListLinePlot

First I rationalized the equations and a defined a solution-function with NSolve

rat[\[CapitalGamma]_] = Rationalize["equations", 0]

nsol[\[CapitalGamma]_] := 
   NSolve[rat[\[CapitalGamma]], {\[Rho]12, \[Rho]13, \[Rho]31, \
     \[Rho]21, \[Rho]11, \[Rho]22, \[Rho]33, \[Rho]23, \[Rho]32}, 
       WorkingPrecision -> 30]

Generate a table of solutions for Gamma from 1/200 to 1/10 (I ignored Gamma = 0, because it has a very diffent behavior.

tab1 = Table[{\[CapitalGamma] -> Gamma, nsol[Gamma]}, {Gamma, 1/200, 
1/10, 1/200}];

Pick out the corresponding values for the 18 solutions and print it (here done for [Rho]12, do the same for the other rho)

Table[{ListLinePlot[
   ta = Table[{\[CapitalGamma] /. tab1[[i, 1]], 
  Re[\[Rho]12 /. tab1[[i, 2, j]]]}, {i, 1, 20}], 
    Epilog -> Point[ta], PlotLabel -> Re, 
    AxesLabel -> {Gamma, \[Rho]12}], 
      ListLinePlot[
  ta = Table[{\[CapitalGamma] /. tab1[[i, 1]], 
  Im[\[Rho]12 /. tab1[[i, 2, j]]]}, {i, 1, 20}], 
    Epilog -> Point[ta], PlotLabel -> Im, 
    AxesLabel -> {Gamma, \[Rho]12}]}, {j, 1, 18}]

enter image description here

$\endgroup$
1
  • $\begingroup$ Thank you very much for your help!!! $\endgroup$ Commented Sep 3, 2017 at 14:28

Your Answer

By clicking “Post Your Answer”, you agree to our terms of service and acknowledge you have read our privacy policy.

Not the answer you're looking for? Browse other questions tagged or ask your own question.