Considering the following physical situation:
and writing the following code:
m := 1.52
g := 9.81
us := 0.15
uk := 0.10
k := 2.12
xi := 4.00
vi := 0.00
tmax := 10

P := m g
Fs := us P
Fk := uk P
Fe[t_] := -k x[t]

sol = NDSolve[{
        Fe[t] - Sign[x'[t]] Fk == m x''[t],
        x[0] == xi,
        x'[0] == vi},
      x, {t, 0, tmax}];

Plot[Evaluate[{
        Sign[x'[t]] Fs,
        Fe[t],
        x[t]} /. sol],
    {t, 0, tmax},
    AxesLabel -> {"t", "fct[t]"},
    PlotLegends -> {"-Fs", "Fe", "x"}]
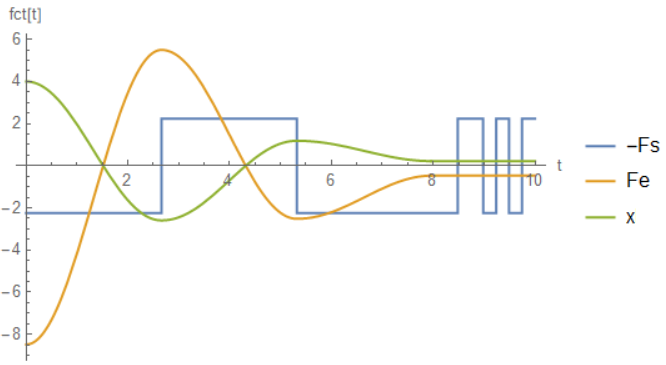
you get the following graph:
which shows that oscillations are over for $t \approx 8\,s$ causes kinematic friction.
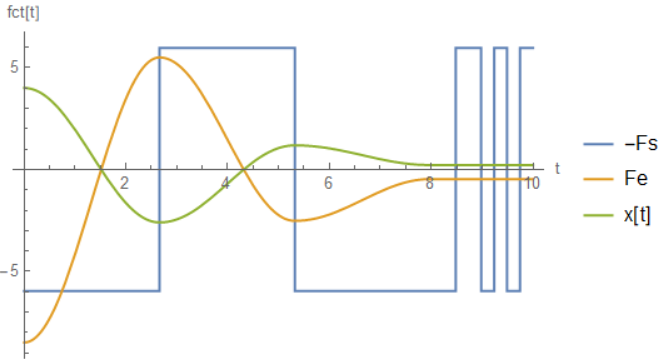
On the other hand, putting us = 0.40 you get this other graph:
which shows that oscillations are over for $t \approx 3\,s$ causes static friction.
Question: is it possible to automate all this by making the x(t) graph plot until the motion stops?


FkinNDSolvebut plotFs. Is this intended? Secondly, what exactly happens at 8s resp. 3s? I don't see anything significant at those times in the plots you provided. (Also,x[t]seems nearly identical between the two plots, is this intended?) $\endgroup$