1
$\begingroup$

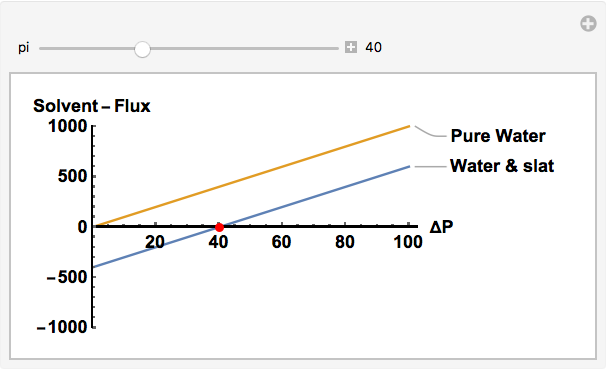
I am trying to add a point in a plot where the curve intercepts the x axis i.e. f[x] = 0 I tried doing an epilog inside an if statement in Plot[] , and it didn't work. here is my code so far

f[pi_, p_] = (10)*(p - pi);
g[p_] = 10*(p);
Manipulate[Plot[{f[pi, p], g[p]}, {p, 0, 50}, PlotLabels -> {"Water & slat", "Pure Water"}, AxesLabel -> {\[CapitalDelta]P, Solvent - Flux}, LabelStyle -> Directive[Bold, Medium],AxesStyle -> Directive[Black], AxesOrigin -> {0, 0}], {pi, 10, 100}, {p, 0, 40}]
$\endgroup$
1
  • $\begingroup$ Instead of an Epilog, you could use the mesh options, e.g., Plot[.., MeshFunctions->{#2&}, Mesh->{{0}}, MeshStyle->Directive[PointSize[Large],Red]] $\endgroup$
    – Carl Woll
    May 23, 2017 at 19:29

1 Answer 1

2
$\begingroup$
f[pi_, p_] = 10*(p - pi);
g[p_] = 10*p;

Clearly, f[pi, p] == 0 for p == pi

Manipulate[
 Plot[{f[pi, p], g[p]}, {p, 0, 100},
  PlotLabels -> {"Water & slat", "Pure Water"},
  AxesLabel -> {ΔP, Solvent - Flux},
  LabelStyle -> Directive[Bold, Medium],
  AxesStyle -> Directive[Black],
  AxesOrigin -> {0, 0},
  Epilog -> {Red, AbsolutePointSize[6],
    Tooltip[Point[{pi, 0}], {pi, 0}]},
  PlotRange -> {{0, 103}, {-1000, 1000}}],
 {{pi, 40}, 10, 100, 1, Appearance -> "Labeled"}]

enter image description here

$\endgroup$

Your Answer

By clicking “Post Your Answer”, you agree to our terms of service and acknowledge you have read our privacy policy.

Not the answer you're looking for? Browse other questions tagged or ask your own question.