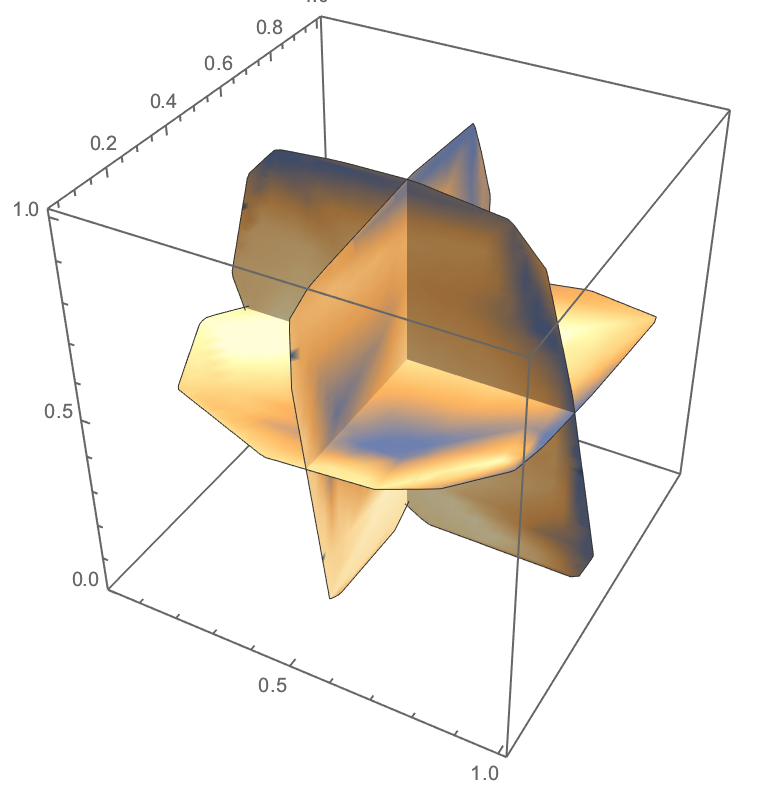
I have a set of data from temperature sensors in an area, 3 coordinates + a temperature value: {x, y, z, t}. The number of points is not that big, 15-20, so it can be typed directly. I need to create gradient temperature maps from it: It could be a cube similar to what Plot3D does but most important I need a set of 2d sections by different height: z = 0.5, z = 1 etc. (The coordinates are in meters.)
I tried to use ListDensityPlot3D for a cube and ListSliceDensityPlot for sections but I can't find a way to feed it with a fixed set of points all documanted examples are about Table(...) defining a function and an interval.
Any idea how to do this? I'm pretty sure it is a trivial task its just that I use Mathematica once per 2-3 years.

