I have the following graph data:
gr={1 -> 2, 1 -> 3, 2 -> 4, 2 -> 5, 3 -> 6, 3 -> 1, 4 -> 7, 4 -> 8,
    5 -> 9, 5 -> 2, 6 -> 10, 6 -> 11, 7 -> 12, 8 -> 13, 8 -> 14, 9 -> 12,
    9 -> 15, 10 -> 4, 11 -> 16, 11 -> 13, 12 -> 17, 12 -> 18, 13 -> 8,
    13 -> 19, 14 -> 18, 14 -> 20, 15 -> 21, 15 -> 9, 16 -> 11, 16 -> 22,
    17 -> 23, 18 -> 14, 18 -> 24, 19 -> 25, 19 -> 26, 20 -> 27, 20 -> 28,
    21 -> 23, 21 -> 25, 22 -> 15, 22 -> 29, 23 -> 30, 23 -> 31,
    24 -> 31, 24 -> 32, 25 -> 33, 25 -> 21, 26 -> 20, 27 -> 34, 27 -> 33,
    28 -> 32, 29 -> 19, 30 -> 35, 31 -> 24, 31 -> 36, 32 -> 37,
    32 -> 38, 33 -> 35, 33 -> 27, 34 -> 39, 34 -> 37, 35 -> 40, 35 -> 41,
    36 -> 41, 36 -> 42, 37 -> 43, 37 -> 34, 38 -> 42, 39 -> 44,
    39 -> 45, 40 -> 39, 41 -> 36, 41 -> 46, 42 -> 47, 42 -> 48, 43 -> 49,
    43 -> 47, 44 -> 49, 45 -> 46, 45 -> 50, 46 -> 45, 46 -> 51,
    47 -> 52, 47 -> 43, 48 -> 51, 49 -> 53, 49 -> 54, 50 -> 54, 50 -> 55,
    51 -> 56, 51 -> 57, 52 -> 58, 52 -> 56, 53 -> 58, 54 -> 50,
    54 -> 59, 55 -> 60, 55 -> 61, 56 -> 62, 56 -> 52, 57 -> 55, 58 -> 63,
    58 -> 64, 59 -> 64, 59 -> 65, 60 -> 66, 60 -> 62, 61 -> 65,
    62 -> 67, 62 -> 60, 63 -> 67, 64 -> 59, 64 -> 68, 65 -> 69, 65 -> 70,
    66 -> 71, 66 -> 69, 67 -> 72, 67 -> 73, 68 -> 73, 68 -> 74, 69 -> 3,
    69 -> 66, 70 -> 74, 71 -> 75, 71 -> 76, 72 -> 71, 73 -> 68,
    73 -> 77, 74 -> 1, 74 -> 78, 75 -> 6, 76 -> 77, 76 -> 16, 77 -> 76,
    77 -> 79, 78 -> 79, 79 -> 5, 79 -> 80, 80 -> 22};
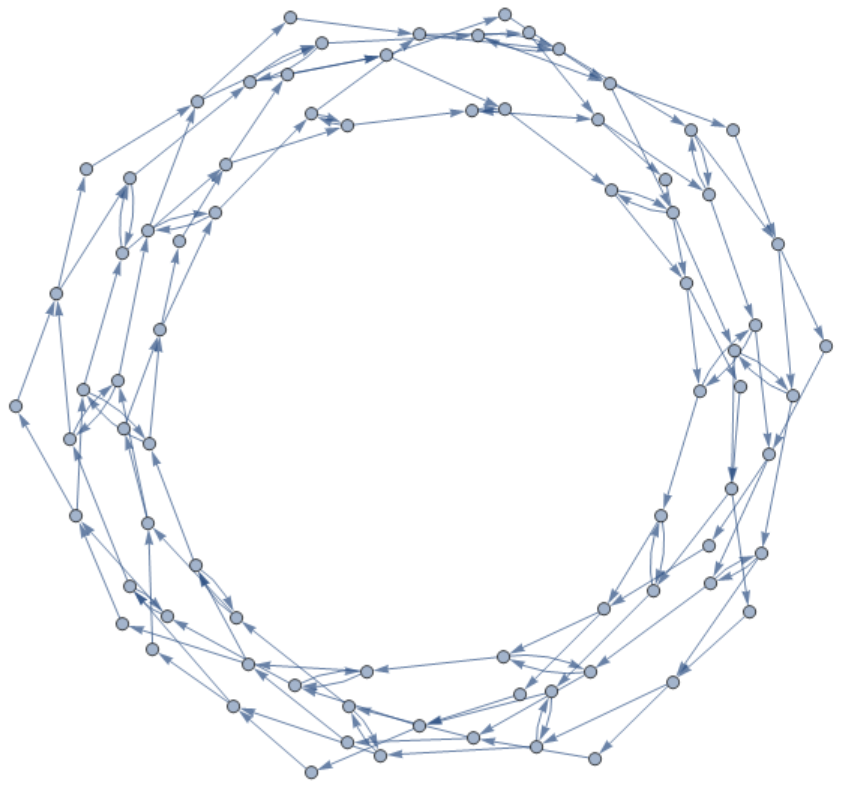
Trying to display the graph, we get from the default function:
Graph[gr]
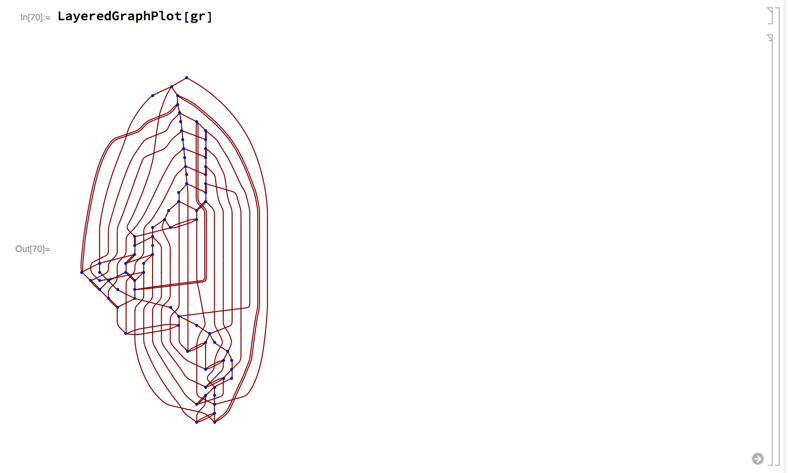
Here we can vaguely see that there are some toroidal features going on. However, the graph is rather busy and not really illuminating. How can I use Mathematica to let it automatically make the geometric features of the graph more clear (without assigning coordinates to vertices by hand)? Ideally, I would prefer the graph to fill out a volume, with an option to click and drag to rotate and zoom. Maybe one can even make the background features half transparent while the foreground is solid (to improve perspective)? Thanks for any suggestion!
EDIT:
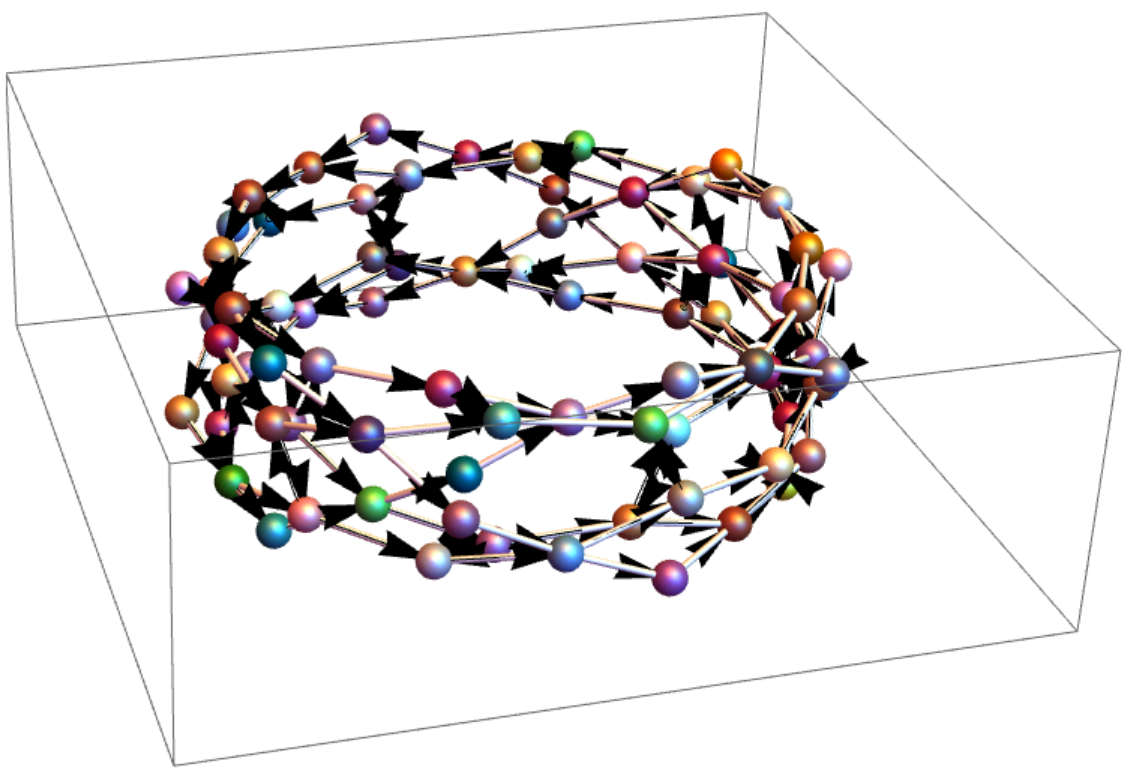
bill s suggested to look at GraphPlot, which led me to GraphPlot3D. Currently I have:
GraphPlot3D[gr, EdgeRenderingFunction -> ({Arrow[#1, 0.01], Cylinder[#1, .03]} &),
VertexRenderingFunction -> ({ColorData["Atoms"][ RandomInteger[{1, 117}]], Sphere[#1, .15]} &),
PlotStyle -> Directive[Specularity[White, 20]]]
This is close to what I imagined. However, the arrows are kind of ugly and too large. I would also prefer to get rid of the surrounding box. Any quick way to fix the arrows and remove the box?

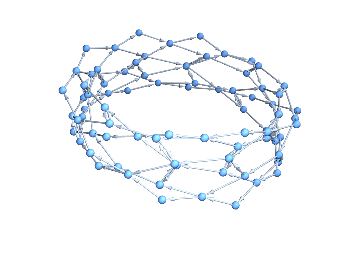
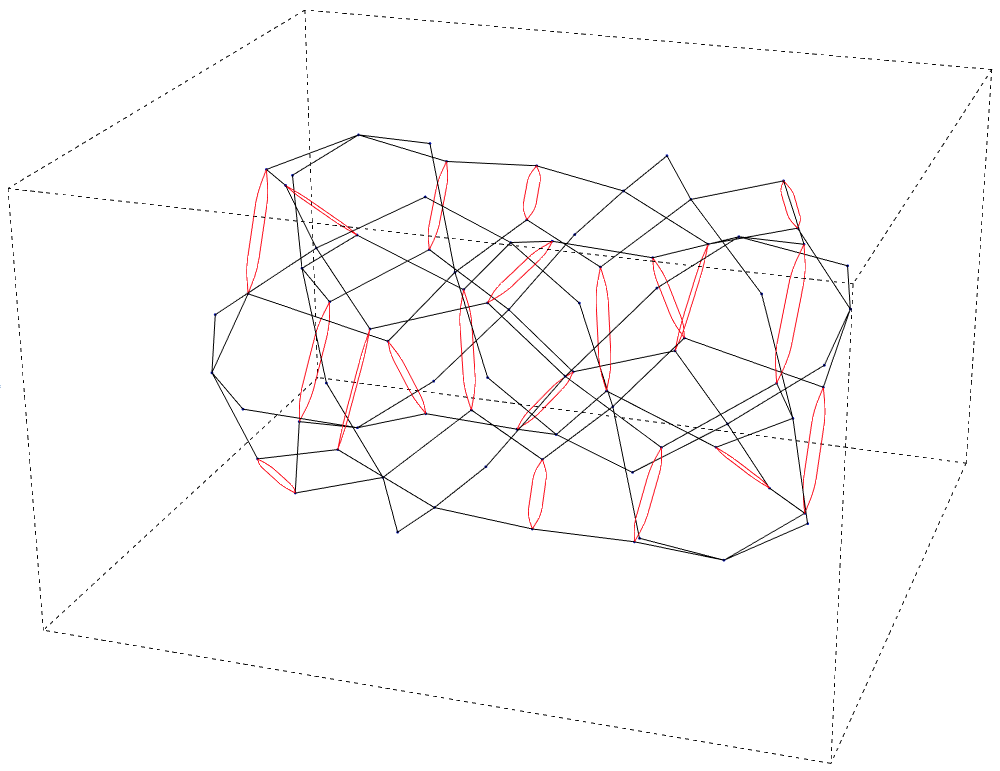
Arrow[#1, 0.01]with{Arrowheads[0.02], Arrow[#1, 0.01]}, and add the optionBoxed -> Falseto theGraphPlot3D. $\endgroup$