Content of the initialization cell:
SetOptions[ListPlot
, Frame -> True
, GridLines -> Automatic
, BaseStyle -> {FontFamily -> "Latin Modern Math", FontSize -> 16}
, PlotMarkers -> {Automatic, 0.001}
];
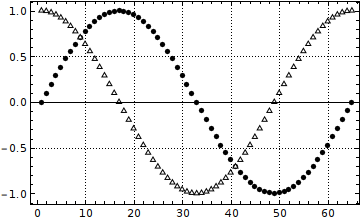
Result, without setting PlotTheme:
Result with PlotTheme -> "Monochrome" added to the ListPlot settings in the initiliazation cell:
As one can easily see, the FontFamily settings were overwritten by the "Monochrome" PlotTheme.
How can I set the monochrome color and plot marker style without overriding my custom plot settings?
Bonus question: How can I globally set (reduce) the PlotMarker size, because the "Monochrome" theme uses a relatively large one by default.


