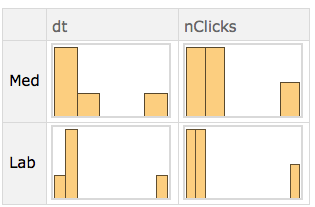
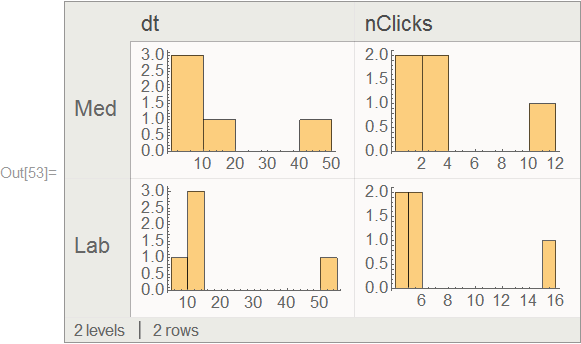
Is there a way to show Histogram (and related plots) axes or frames in v11 Dataset?
ds = <|"Med" -> <|"dt" -> {48, 13, 0, 1, 0},
     "nClicks" -> {10, 3, 1, 2, 1}|>,
   "Lab" -> <|"dt" -> {13, 9, 51, 10, 13},
     "nClicks" -> {5, 4, 15, 4, 5}|>|> // Dataset
Then
ds[All, All, Histogram[#, Frame -> True] &]
In v10, a usable workaround was to wrap Framed (if needed, an invisible one w/ Opacity 0) at the 2nd level, but v11 broke that and instead you get useless ...
ds[All, Framed, Histogram]


ds[All,Framed,Histogram]ends up applying theFramedfunction to the row-level association, which looks like<|"Med" -> {{48, 13, 0, 1, 0}, {10, 3, 1, 2, 1}}, "Lab" -> {{13, 9, 51, 10, 13}, {5, 4, 15, 4, 5}}|>. Try usingds[All,All,Histogram/*Framed]instead. $\endgroup$