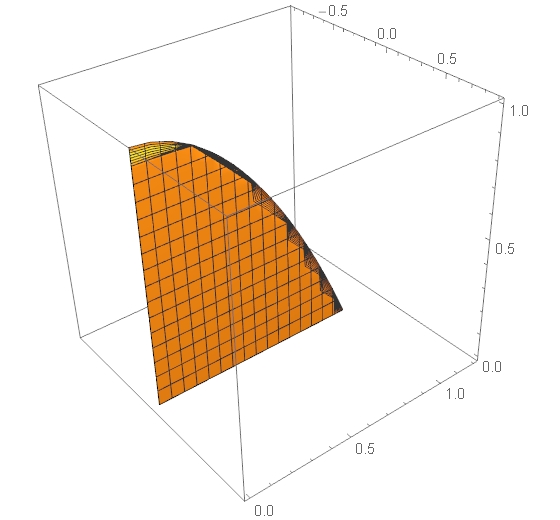
I faced a strange behavior of a RegionPlot3D. I am drawing a piece of a plane bounded by a parabola. This works:
    RegionPlot3D[
 z < 1 - V^2 && (-0.001 < x < 0.001), {x, -0.9, 0.9}, {V, 0, 1.2}, {z,
   0, 1}]
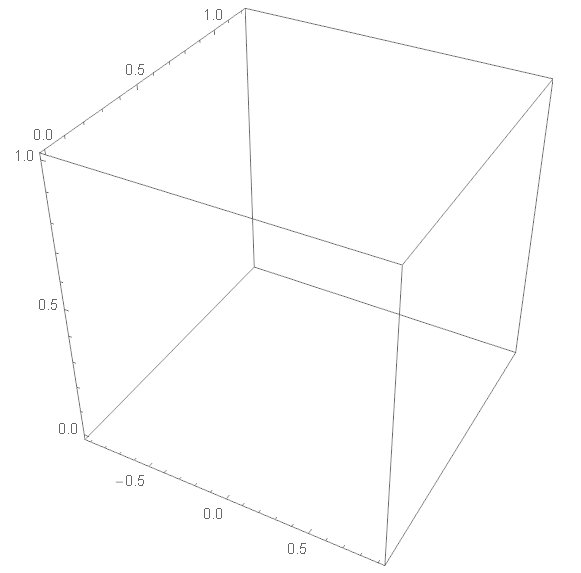
Now I would like to shift it over -0.1 along x:
 RegionPlot3D[
 z < 1 - V^2 && ((-0.001 - 0.1) < x < (0.001 - 0.1)), {x, -0.9,
  0.9}, {V, 0, 1.2}, {z, 0, 1}]
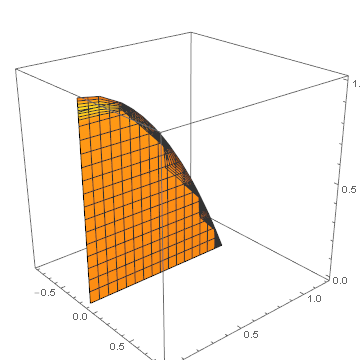
with the following result:
Do I miss something? If not, do you see a workaround?


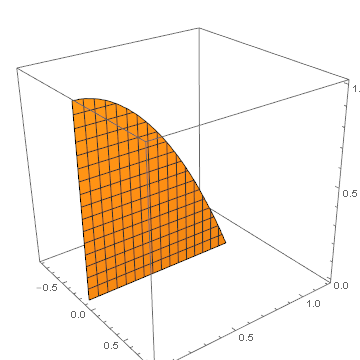
{x, -1, 0.8}Works, looks like a rendering bug though $\endgroup$-1 < x < -0.99does not work $\endgroup$PlotPoints -> {100, Automatic, Automatic}$\endgroup$