My friend asked me if we can plot a 3D model of DNA (deoxyribonucleic acid) in Mathematica. However, I am not really familiar with this and I don't know if Mathematica can do this. Could you answer the question or give me some ideas to do this? Thank you very much for your help!
-
2$\begingroup$ See: demonstrations.wolfram.com/DoubleHelix and reference.wolfram.com/language/ref/ProteinData.html $\endgroup$– Baran CimenCommented May 19, 2016 at 8:25
-
$\begingroup$ Thank you very much. I am trying that now. $\endgroup$– emnhaCommented May 19, 2016 at 9:16
3 Answers
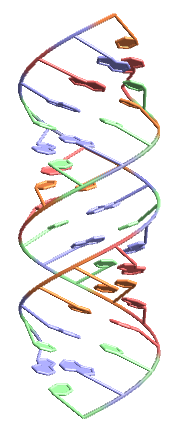
The easiest way to do this is if you have a PDB file, then it's as easy as using Import. Here are a few examples from the RCSB's Protein Data Bank. To get the URLs, find a page for a given sequence or protein and right-click on the link next to "DOI:" and copy the link.
Import[#, "PDB"] & /@ {"http://files.rcsb.org/download/5ET9.pdb",
  "http://files.rcsb.org/download/1BNA.pdb",
  "http://files.rcsb.org/download/208D.pdb",
  "http://files.rcsb.org/download/1D91.pdb",
  "http://files.rcsb.org/download/5A0W.pdb"}
But wouldn't it be cool if you could just input a DNA sequence and have a plot? Well, I can't figure out how to get Mathematica to do that without outside help, but it can be done,
GenomeData[{"ChromosomeY", {99, 132}}]
(* "GCCTGAGCCAGCAGTGGCAACCCAATGGGGTCCC" *)
Take that little snippet and paste it into the form on this site, then you can download a PDB file to import,
Theoretically, this could be incorporated into Mathematica since it is done using NAB, part of AmberTools, which are under a GNU license.
-
$\begingroup$ beautiful...nice resource to explore. +1 of course :) $\endgroup$– ubpdqnCommented May 19, 2016 at 9:00
-
$\begingroup$ Thank you very much for the answer. $\endgroup$– emnhaCommented May 19, 2016 at 9:17
-
$\begingroup$ Could you tell me how did you know these files pdb? I tried to follow the link above but I didn't see any file like that. files.rcsb.org/download $\endgroup$– emnhaCommented May 19, 2016 at 9:51
-
2$\begingroup$ @anhnha - there is apparently an easier way to do it than what I did. Go to the link above, then click on one of the proteins, like this one. Right click on the link next to the DOI and copy the link location. Then just use that link, via
Import["http://dx.doi.org/10.2210/pdb2nba/pdb", "PDB"]$\endgroup$– Jason B.Commented May 19, 2016 at 9:54 -
$\begingroup$ Thanks a lot for the guide. It works now. $\endgroup$– emnhaCommented May 19, 2016 at 10:07
This was supposed to be a comment to Jason's answer, but it got a bit long.
But wouldn't it be cool if you could just input a DNA sequence and have a plot? ... take that little snippet and paste it into the form on this site, then you can download a PDB file to import...
By looking through the source of the make-na server form, I was able to figure out what to pass into the page's CGI and how to pass them via URLExecute[]. Here is what I came up with:
Options[MakeDNA] = {Background -> White, ColorFunction -> "Residue", "HelixType" -> "A",
                    ImageSize -> Automatic, "Hydrogens" -> False,
                    "Rendering" -> "Structure", "SingleStranded" -> False,
                    ViewPoint -> Automatic};

MakeDNA[seq_String, opts : OptionsPattern[]] := Module[{params},
        params = {"distro" -> "make-na", "seq_name" -> "0",
                  "helix_type" -> OptionValue["HelixType"],
                  "f_acid_type" -> "dna", "r_acid_type" -> "dna", "description" -> seq,
                  "file_type" -> "pdb", "f_cid" -> "A", "r_cid" -> "B",
                  "f_first_num" -> 1, "r_first_num" -> 1, "sugar_indi" -> "asterisk",
                  "hydrogens" -> If[TrueQ[OptionValue["Hydrogens"]], "yes", "no"],
                  "f_codelen" -> 1, "r_codelen" -> 1};
        If[TrueQ[OptionValue["SingleStranded"]],
           AppendTo[params, "single_strand" -> "SS"]];
        ImportString[URLExecute["http://structure.usc.edu/cgi-bin/make-na/make-na.cgi",
                                params, "String", Method -> "POST"], "PDB",
                     FilterRules[Join[{opts}, Options[MakeDNA]],
                                 {Background, ColorFunction, ImageSize,
                                  "Rendering", ViewPoint}]]]
Most of the parameters are set to their defaults on the web form; see this page for sundry instructions on how to set them, as well as how to specify the input nucleic acid sequence (e.g. 5' -> 3', if you are specifying only one strand) and the limitations of the service.
Here are some examples:
MakeDNA["ATACCGATACGATAGAC"]

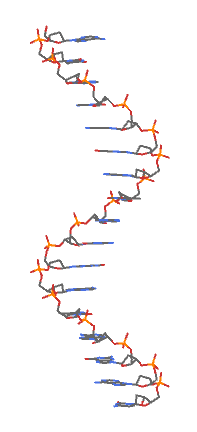
MakeDNA["ATACCGATACGATAGAC", "HelixType" -> "SB", "SingleStranded" -> True,
        "Rendering" -> "Wireframe"]

It should not be too hard to modify/generalize this function so that it can also return RNA models.
-
-
$\begingroup$ That is great!! I was trying to do this but couldn't quite figure it out $\endgroup$– Jason B.Commented May 21, 2016 at 18:01
-
$\begingroup$ @J.M. - is this site down for good, or am I just having trouble with it at the moment? $\endgroup$– Jason B.Commented Mar 5, 2018 at 22:41
-
$\begingroup$ @Jason, it seems kaput, and the author has not given any updates. At worst, one may have to write an interface to NAB from scratch. $\endgroup$ Commented Mar 5, 2018 at 23:25
Here is a function that can wrap a double helix around any (sufficiently smooth) parameterized curve. Among other things, the function below computes a Bishop frame along the curve; twisting it leads essentially to the double helices. In principle, the Bishop frame can be used to transport arbitrary geometric objects along the curve.
ClearAll[MakeDNA];
SetAttributes[MakeDNA, HoldAll]
MakeDNA[DNAcode_, curve_, {t_, a_, b_}, OptionsPattern[{
    "HelixRadius" -> 0.125,
    "HelixFrequency" -> 4,
    "SingleStranded" -> False,
    "LineThickness" -> .1,
    "StartingFrameVector" -> Automatic
    }]] :=
 Module[{γ},
  Block[{charlist, ω, T, κ, A, frame, frame1, frame2,
    eq, sol, δ1, δ2, col, opp, piece, line, mlist, n,
    tlist, s, r, θ, u0},
   γ = s \[Function] Evaluate[Evaluate[curve] /. t -> s];
   r = OptionValue["HelixRadius"];
   θ = OptionValue["LineThickness"];
   charlist = Characters[DNAcode];
   n = Length[charlist];
   tlist = Subdivide[a, b, n];

   (* unit tangent vector *)
   T = t \[Function] Evaluate[γ'[t]/Sqrt[γ'[t].γ'[t]]];
   (* curvature vector *)
   κ = t \[Function] Evaluate[T'[t]/Sqrt[γ'[t].γ'[t]]];
   (* compute Bishop frame *)

   u0 = OptionValue["StartingFrameVector"];
   If[! VectorQ[u0],
    u0 = IdentityMatrix[3][[Ordering[Abs[γ'[0]], 1][[1]]]];
    ];

   A = t \[Function]
     Evaluate[
      Array[ToExpression["a" <> ToString[#1] <> ToString[#2]][
         t] &, {3, 3}]];
   sol = NDSolve[
      Evaluate@Thread[Flatten[{A'[t][[1]] -  Sqrt[γ'[t].γ'[t]] (A[t][[2]] A[t][[2]].κ[t] + A[t][[3]] A[t][[3]].κ[t]), A'[t][[2]] + Sqrt[γ'[t].γ'[t]] (A[t][[1]] A[t][[2]].κ[t]), A'[t][[3]] + Sqrt[γ'[t].γ'[t]] (A[t][[ 1]] A[t][[3]].κ[t]), A[0] - Orthogonalize[{T[0], u0, Cross[T[0], u0]}] }] == 0],
      Evaluate[Flatten[A[t]]],
      {t, a, b}
      ][[1]];
   frame = t \[Function] Evaluate[A[t] /. sol];


   (*angle correction so that DNA closes*)
   ω = OptionValue["HelixFrequency"];
   If[(Norm[γ[a] - γ[b]] < 10^-8) && (Norm[γ'[a] - γ'[b]] < 10^-8),
      ω -= ArcTan @@ LinearSolve[Transpose[frame[b]], Transpose[frame[a]]][[2, 2 ;; 3]]/(b - a)/(2 Pi);
     ];
   frame1 = t \[Function] {
     frame[t][[1]],
     frame[t][[2]] Cos[2 Pi ω t] + frame[t][[3]] Sin[2 Pi ω t],
     -frame[t][[2]] Sin[2 Pi ω t] + frame[t][[3]] Cos[2 Pi ω t]
     };
   frame2 = t \[Function] {
     frame[t][[1]],
     -(frame[t][[2]] Cos[2 Pi ω t] + frame[t][[3]] Sin[2 Pi ω t]),
     frame[t][[2]] Sin[2 Pi ω t] - frame[t][[3]] Cos[2 Pi ω t]
     };

   (* the actual helices *)
   δ1 = t \[Function] γ[t] + r frame1[t][[2]];
   δ2 = t \[Function] γ[t] + r frame2[t][[2]];

   piece["A"] = {p, frame, scale} \[Function] {col["A"], Specularity[White, 30], Tube[{p, p - r frame[[2]]}, scale r/2]};
   piece["C"] = {p, frame, scale} \[Function] {col["C"], Specularity[White, 30], Tube[{p, p - r frame[[2]]}, scale r/2]};
   piece["G"] = {p, frame, scale} \[Function] {col["G"], Specularity[White, 30], Tube[{p, p - r frame[[2]]}, scale r/2]};
   piece["T"] = {p, frame, scale} \[Function] {col["T"], Specularity[White, 30], Tube[{p, p - r frame[[2]]}, scale r/2]};
   line = {p1, p2, c, scale} \[Function] {col[c], Tube[{p1, p2}, scale r/2]};
   col["A"] = Darker@Darker@Blue;
   col["T"] = Orange;
   col["C"] = Darker@Darker@Green;
   col["G"] = Darker@Red;
   opp["A"] = "T";
   opp["T"] = "A";
   opp["G"] = "C";
   opp["C"] = "G";
   mlist = MovingAverage[tlist, 2];
   Show[
    Graphics3D[{
      Table[piece[charlist[[i]]][δ1[mlist[[i]]], frame1[mlist[[i]]], θ], {i, 1, n}],
      Table[line[δ1[tlist[[i]]], δ1[tlist[[i + 1]]], charlist[[i]], 2 θ], {i, 1, n}],
      If[! TrueQ[OptionValue["SingleStranded"]],
       {
        Table[piece[opp@charlist[[i]]][δ2[mlist[[i]]], frame2[mlist[[i]]], θ], {i, 1, n}],
        Table[line[δ2[tlist[[i]]], δ2[tlist[[i + 1]]], opp@charlist[[i]], 2 θ], {i, 1, n}]
        }
       ]
      }
     ],
    Lighting -> "Neutral"
    ]
   ]
  ]
Some basic examples:
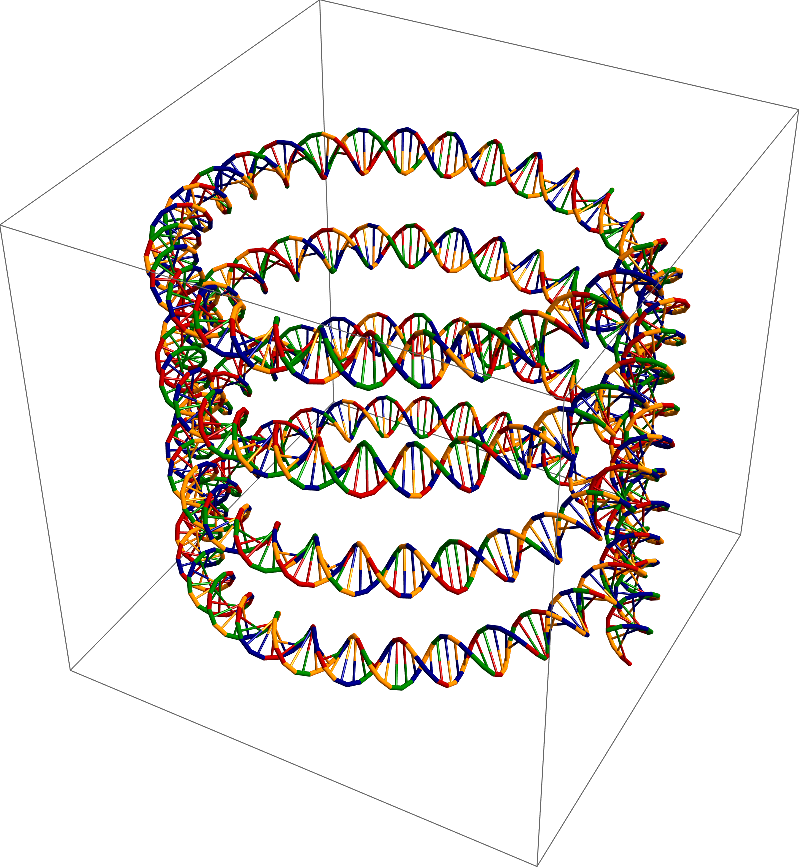
DNAcode = StringJoin[RandomChoice[{"A", "C", "G", "T"}, {720}]]
γ = t \[Function] {Cos[2 Pi t], Sin[2 Pi t], 0.5 t};
MakeDNA[DNAcode, γ[t], {t, -2, 2},
 "SingleStranded" -> False,
 "HelixFrequency" -> 16,
 "HelixRadius" -> 0.1
 ]
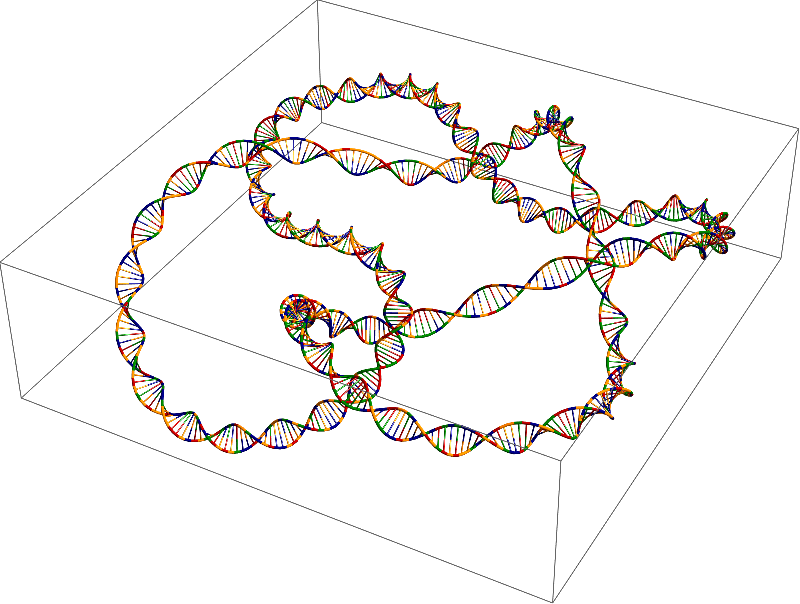
As I said, the curve can be quite arbitrary:
γ = With[{data = DataPaclets`KnotDataDump`RawKnotData[
     KnotData["Stevedore", "AlexanderBriggsList"],
     "GraphicsData"
     ]},
   BSplineFunction[
    data[[1]].DiagonalMatrix[data[[3]]],
    SplineClosed -> True,
    SplineDegree -> 3
    ]
   ];
DNAcode = StringJoin[RandomChoice[{"A", "C", "G", "T"}, {720}]]
g = MakeDNA[DNAcode, γ[t], {t, 0, 1},
  "SingleStranded" -> False,
  "HelixFrequency" -> 36,
  "HelixRadius" -> 0.025
  ]
-
$\begingroup$ Very nice! But I must note something in your definition of
opp: the opposite of"A"should be"T", and the opposite of"G"should be"C". $\endgroup$ Commented Mar 10, 2018 at 22:10 -
1$\begingroup$ Wow, some read the code very carefully... Thanks for the hint! I fixed it. $\endgroup$ Commented Mar 11, 2018 at 0:34
-
$\begingroup$ Also, there is this paper that claims to combine the best aspects of the Frenet-Serret and Bishop frames, but I haven't had the time to investigate. $\endgroup$ Commented Mar 11, 2018 at 0:36
-
1$\begingroup$ @HenrikSchumacher this is awesome, I have to say this. Just....wow. $\endgroup$ Commented Jun 28, 2019 at 19:43
-
$\begingroup$ @CATrevillian Oh, thank you so much! $\endgroup$ Commented Jun 28, 2019 at 19:52


