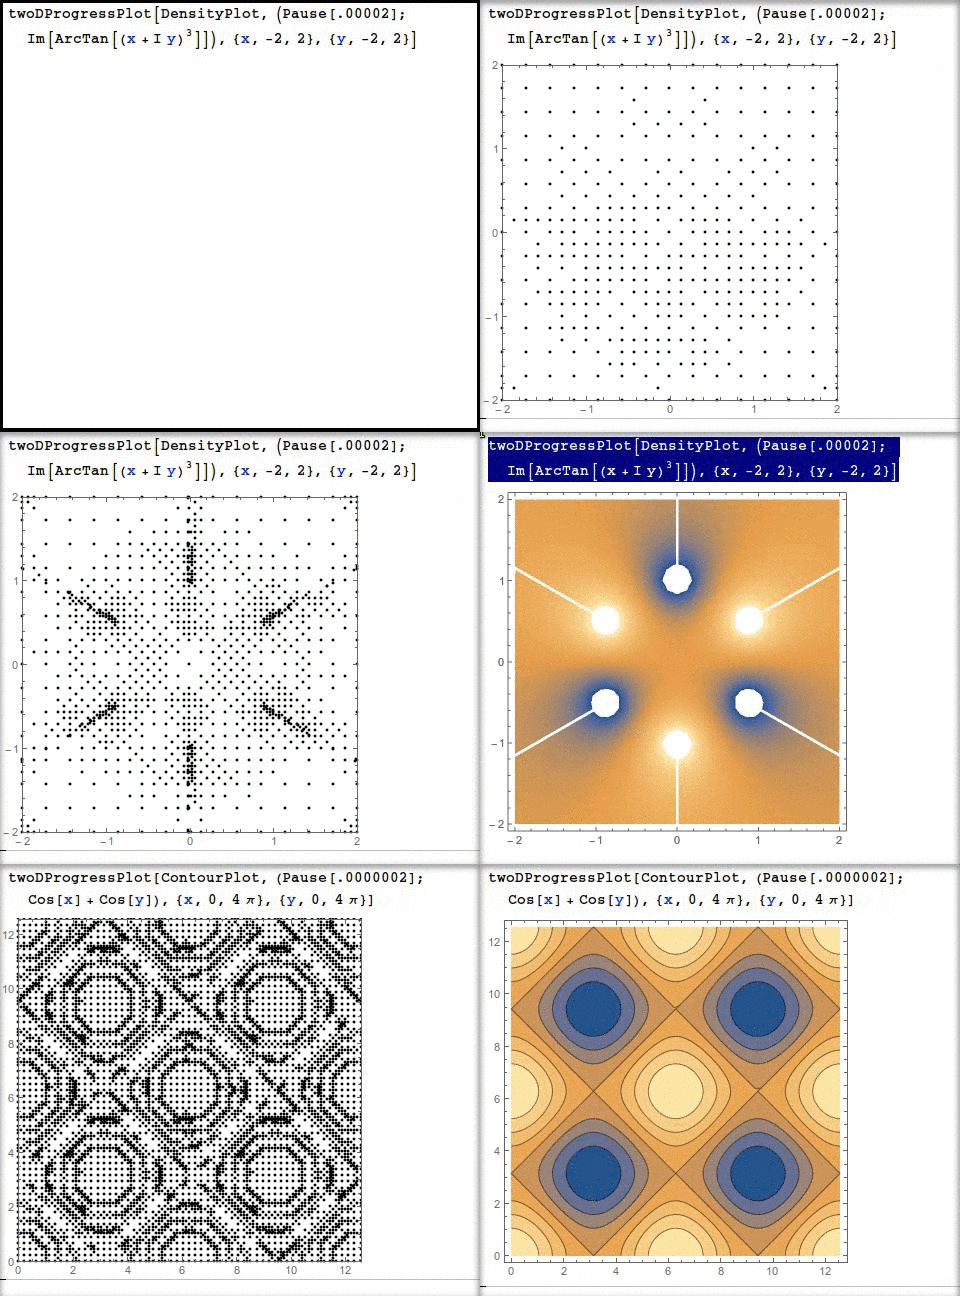
I came across Rojo's answer on the Mathematica Stack to the following questions:
"Estimating progress on plots"
Could somebody please help me revise this code for the Plot function:
SetAttributes[celtschkPlot, HoldAll];
celtschkPlot[fun_, {v_, r1__}, mr_: 6, op : OptionsPattern[]] :=
 Module[{i = 0, xant},
  Monitor[Plot[fun, {v, r1}, MaxRecursion -> mr,
    EvaluationMonitor :> (If[v < xant, ++i]; xant = v), op],
   ProgressIndicator[i, {0, 2^mr}]]]
to the ContourPlot function with two or three variables such as:
ContourPlot[x^2 - y^2, {x, -2, 2}, {y, -2, 2}, Contours -> {-1, 0, 1}]
or
ContourPlot3D[x^2 + y^2 - z^2, {x, -2, 2}, {y, -2, 2},
     {z, -2, 2},Contours -> 5, Mesh -> None]
and please give me an usage example.
Thanks to Rojo and others in adavance.
I. Konuk

