3
$\begingroup$

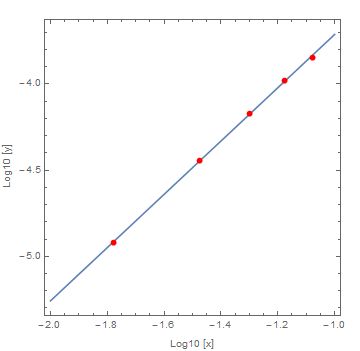
I fitted data belonging to a MSD (mean squared displacement of a vibrating micrometer sized particle) by using a linear function:

data = {{0.0166667, 0.0000119831}, {0.0333333, 0.0000361185}, {0.05, 0.0000672071}, 
        {0.0666667, 0.00010521}, {0.0833333, 0.000142751}}; 

datalog = Log10[data];

model = a*x + b;
fit = FindFit[datalog, model, {a, b}, x]; 
modelf = Function[{x}, Evaluate[model /. fit]];

Plot[modelf[t], {t, -2, -1}, Epilog -> {Red, PointSize[0.02], Point[datalog]}, 
     PlotStyle -> AbsolutePointSize[10], Frame -> True, AspectRatio -> 1, 
     FrameLabel -> {{"Log10 [y]", ""}, {"Log10 [x]", ""}}]

The result is:

enter image description here

fit yields the fittings parameters. From the slope one can calculate the diffusion coefficient.

To get the standard deviation of the fitting parameters I used:

lm = LinearModelFit[datalog, x, x];
lm["ParameterTable"]

which gives:

enter image description here

My question: Is there another possibility to obtain the errors of the fit parameters (from FindFit) without calling LinearModelFit and ParameterTable?

$\endgroup$
6
  • $\begingroup$ Why linearize when nonlinear regression capabilities are available? FindFit[data, a x^b, {a, b}, x] $\endgroup$ Commented Mar 31, 2016 at 11:36
  • $\begingroup$ Thank you for your comment ... how can I obtain the errors of the fit parameters (a,b)? $\endgroup$
    – mrz
    Commented Mar 31, 2016 at 11:54
  • 1
    $\begingroup$ Can you explain why you want to avoid LinearModelFit/NonlinearModelFit in favour of FindFit? What's wrong with NonlinearModelFit? It also calls FindFit internally, but it also does additional calculations to get the errors. You'll need to do these manually if you don't want NonlinearModelFit. $\endgroup$
    – Szabolcs
    Commented Mar 31, 2016 at 11:59
  • 1
    $\begingroup$ @mrz - the easiest way would be to use LinearModelFit or NonlinearModelFit, but I take it you want the formula used to calculate these for academic purposes. I'd look at this page and this page $\endgroup$
    – Jason B.
    Commented Mar 31, 2016 at 11:59
  • 1
    $\begingroup$ ...and if you do use NonlinearModelFit[], you can use the "ParameterErrors" property of the resulting FittedModel[] object. $\endgroup$ Commented Mar 31, 2016 at 12:15

1 Answer 1

4
$\begingroup$

Using fit as computed and formula for standard error here.

enter image description here

Clear[a, b];
{a, b} = {a, b} /. fit;
regressedpoints = a # + b & /@ datalog[[All, 1]];
n = Length[datalog];
errors = datalog[[All, 2]] - regressedpoints;
meanx = Mean[datalog[[All, 1]]];
Sqrt[(Total[errors^2]/(n - 2))/Total[(datalog[[All, 1]] - meanx)^2]]

0.0174645

Not sure about the other value.

$\endgroup$
6
  • $\begingroup$ Nevertheless, I'd be iffy about concluding anything when the standard error computed here was derived from a linearization, which also distorts the errors in the data. $\endgroup$ Commented Mar 31, 2016 at 12:48
  • $\begingroup$ Thank you this is exactly the same result for the slope as obtained by LinearModelFit ... $\endgroup$
    – mrz
    Commented Mar 31, 2016 at 12:49
  • 1
    $\begingroup$ The standard error of the intercept (a) can be determined using the standard error of the slope (call it seb) as sea = seb Sqrt[Total[datalog[[All, 1]]^2]/n]. $\endgroup$
    – JimB
    Commented Mar 31, 2016 at 14:49
  • $\begingroup$ I disagree with @J.M. that linearization "distorts the errors in the data". While linearization should not be blindly applied, it many times makes the relationship more linear AND results in errors that more closely match what the fitting procedures (in their default mode) assume: a constant variance for all values of the predictor. My observation is that many responses on this site tend to ignore the error structure assumptions and the examination of residuals. However, in this particular case with only 5 observations, there's not much one can do. $\endgroup$
    – JimB
    Commented Mar 31, 2016 at 14:53
  • $\begingroup$ @Jim, since least squares is done under the assumption that errors in the data follow a normal distribution, a linearization transformation would result in something whose errors aren't exactly Gaussian anymore, right? Or am I missing something? $\endgroup$ Commented Mar 31, 2016 at 14:58

Your Answer

By clicking “Post Your Answer”, you agree to our terms of service and acknowledge you have read our privacy policy.

Not the answer you're looking for? Browse other questions tagged or ask your own question.