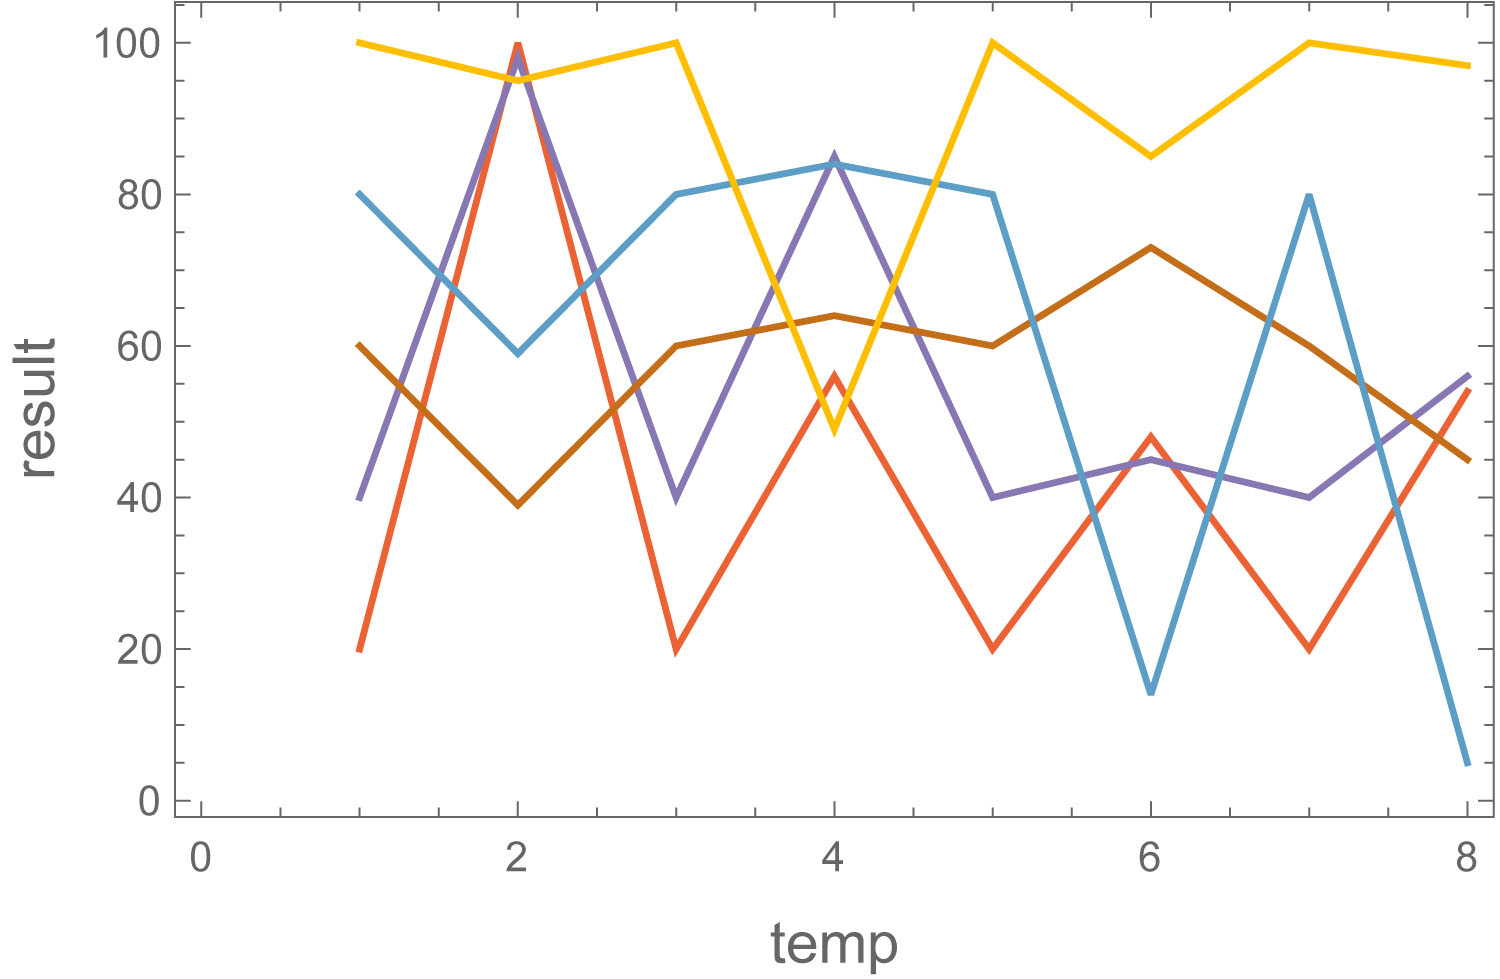
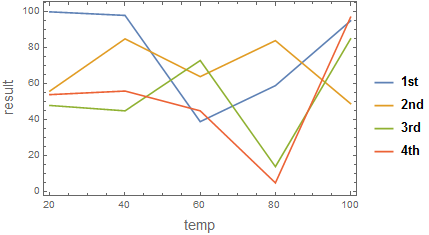
I have a simple question and it could be very basic tips for many. I tried to find the answer several hours by searching, but couldn't find the way yet. My question is, if I have a data set (x1y1, x2y2, x3y3, x4y4...). What's the most simple and elegant way to plot this data set? How would you do it? Many many thanks in advance.
testdata = {{"", "1st", "", "2nd", "", "3rd", "", "4th"}, {"C", "%",
    "", "", "", "", "", ""}, {"temp", "result", "", "", "", "", "",
    ""}, {20, 100, 20, 56, 20, 48, 20, 54}, {40, 98, 40, 85, 40, 45,
    40, 56}, {60, 39, 60, 64, 60, 73, 60, 45}, {80, 59, 80, 84, 80,
    14, 80, 5}, {100, 95, 100, 49, 100, 85, 100, 97}};
TableForm@testdata
ListLinePlot[testdata, Frame -> True, Axes -> False,
 PlotLegends -> testdata[[1]],
 FrameLabel -> (Style[#, 14] & /@ {testdata[[3, 1]],
     testdata[[3, 2]]})]


testDatanumerical physical quantity values or contingency values (counts). $\endgroup$