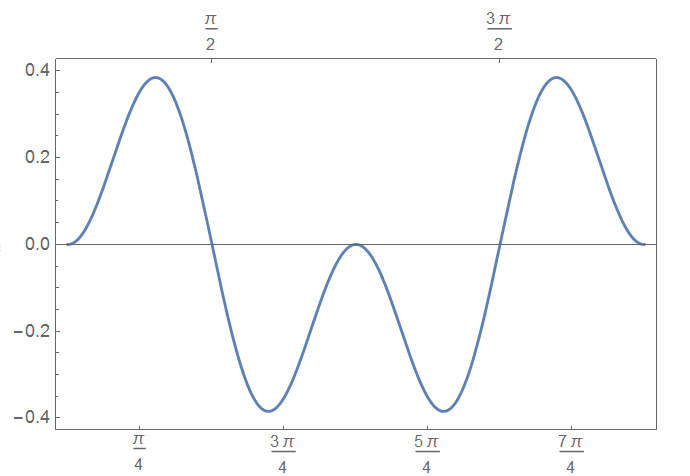
I plotted a simple function with:
   npi2 = {π/2, 3 π/2};
   npi3 = {π/3, 2 π/3, 4 π/3, 5 π/3};
   npi4 = {π/4, 3 π/4, 5 π/4, 7 π/4};
   Plot[Sin[x]^2 Cos[x], {x, 0, 2 π}, Frame -> True,
   FrameTicks -> {{Automatic, npi3}, {npi4, npi2}}]
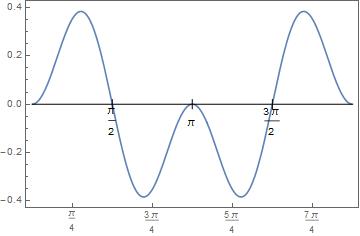
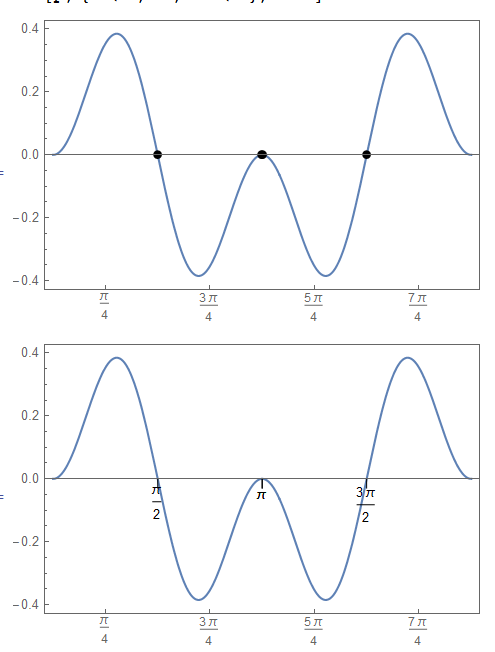
But the desired case is to show the roots (which should be automatically calculated) of the function with a special Ticks which be on the x-axis (not as FrameTicks) (exactly on an horizontal axis passed through the origin)


