5
$\begingroup$

I have to solve a complicated equation numerically f(z,k)=0 with z = x + i y a complex variable and k a real, involving an integral of the inverse hyperbolic tangent function ArcTanh:

f[z_?NumericQ]:=1-k^2/z^2-5.811300019879834`*^7/k^2 NIntegrate[s Sqrt[s^2-1] (1-1/z-(s ((1-1/z)^2-(k^2 (s^2-1))/(s^2 z^2)) z ArcTanh[(k Sqrt[s^2-1])/(s (z-1))])/(k Sqrt[s^2-1]))Exp[-10 s],{s,1,Infinity},MaxRecursion->50,AccuracyGoal-> 1000]

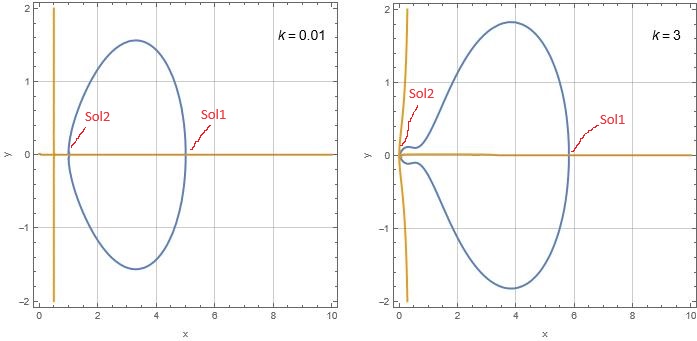
However, FindRoot seems to be unable to find a solution for some values of k. But using ContourPlot, I can obtain a graph of the existing solutions within a few seconds:

$Version
"14.0.0 for Microsoft Windows (64-bit) (December 13, 2023)"

ClearAll["Global`*"]
(*k=0.01;*)

f[x_?NumericQ,y_?NumericQ]:=1-k^2/(x+I y)^2-5.811300019879834`*^7/k^2 NIntegrate[s Sqrt[s^2-1] (1-1/(x+I y)-(s ((1-1/(x+I y))^2-(k^2 (s^2-1))/(s^2 (x+I y)^2)) (x+I y) ArcTanh[(k Sqrt[s^2-1])/(s (x+I y-1))])/(k Sqrt[-1+s^2]))Exp[-10s],{s,1,Infinity},MaxRecursion->5,AccuracyGoal-> 1000]

ContourPlot[{Re@f[x,y]==0,Im@f[x,y]==0},{x,0,10},{y,-2,2},PlotPoints->20,FrameLabel->{TraditionalForm["x"],TraditionalForm["y"]},GridLines->Automatic]

The ContourPlot:

enter image description here

The above two ContourPlots show that there are two solutions of the equation in the complex plane, sol1(k) and sol2(k), at the intersection of the curves Re[f]=0 and Im[f]=0, but sol2(k) is too difficult to find with FindRoot.

So I have two questions to ask:

  1. How to get/extract all sol1(k) and sol2(k) from ContourPlot without FindRoot?

  2. sol1 is easy to calculate by FindRoot, however sol2 is difficult to obtain, in particular for k>2 I get sol2=sol1, which is impossible, so how to compute and plot it for 0<k<20? I specify that for all k, Re[sol2]<1 and Im[sol2]<0.

    sol1[k_]:=z/. FindRoot[ 1-k^2/z^2-5.811300019879834`*^7/k^2 NIntegrate[s Sqrt[s^2-1](1-1/z-(s ((1-1/z)^2-(k^2 (s^2-1))/(s^2 z^2)) z ArcTanh[(k Sqrt[s^2-1])/(s (z-1))])/(k Sqrt[s^2-1]))Exp[-10 s],{s,1,Infinity},MaxRecursion->50,AccuracyGoal-> 1000]==0,{z,2+0.00001I},AccuracyGoal->5,MaxIterations->1000]
    
    Block[{k = 1.5}, {sol1[k], sol2[k]}]
    (*{5.220643413381576`-1.6472483643990675`*^-13 I,0.07822391435385899`+2.2735003026465596`*^-15 I}*)
    
    
    sol2[k_]:=z/. FindRoot[ 1-k^2/z^2-5.811300019879834`*^7/k^2 NIntegrate[s Sqrt[s^2-1](1-1/z-(s ((1-1/z)^2-(k^2 (s^2-1))/(s^2 z^2)) z ArcTanh[(k Sqrt[s^2-1])/(s (z-1))])/(k Sqrt[s^2-1]))Exp[-10 s],{s,1,Infinity},MaxRecursion->50,AccuracyGoal-> 1000]==0,{z,0.0001-0.000001 I},AccuracyGoal->5,MaxIterations->1000]
    
    Block[{k = 2}, {sol1[k], sol2[k]}]
    (*{5.382348544051253`-2.5539453851686417`*^-12 I,5.38234854405347`-4.1359030627651384`*^-23 I}*)
    
$\endgroup$
2
  • 1
    $\begingroup$ Good luck! Complex root finding is really hard and requires magic. In the past, I've used Mathematica to find the intersections between the zero-contours of the real and imaginary parts using GraphicsMeshFindIntersections[plot], then feeding the results to FindRoot to refine the roots. It doesn't seem to work for your difficult points, though. $\endgroup$
    – march
    Commented Mar 8 at 22:16
  • $\begingroup$ Thank you @march for the comment. $\endgroup$
    – Gallagher
    Commented Mar 9 at 14:30

2 Answers 2

4
$\begingroup$

To select points Sol1,Sol2 we use Select at points extracting from ContourPlot as follows

f[x_?NumericQ, y_?NumericQ] := 
 1 - k^2/(x + I  y)^2 - 
  5.811300019879834`*^7/k^2  NIntegrate[
    s  Sqrt[s^2 - 1]  (1 - 
       1/(x + I  y) - (s  ((1 - 
               1/(x + I  y))^2 - (k^2  (s^2 - 
                 1))/(s^2  (x + I  y)^2))  (x + 
            I  y)  ArcTanh[(k  Sqrt[
               s^2 - 1])/(s  (x + I  y - 1))])/(k  Sqrt[-1 + 
            s^2])) Exp[-10 s], {s, 1, Infinity}]

plot = Table[
  ContourPlot[{Re@f[x, y] == 0, Im@f[x, y] == 0}, {x, 0, 10}, {y, -2, 
    2}, PlotPoints -> 20, 
   FrameLabel -> {TraditionalForm["x"], TraditionalForm["y"]}, 
   GridLines -> Automatic], {k, {.01, 3}}] 
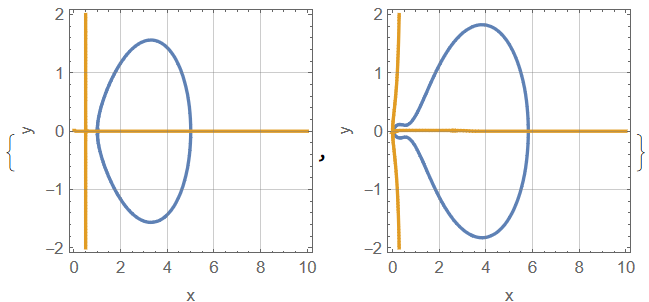
Figure 1

To extract points from plot we use

point1 = plot[[1]][[1, 1]][[1]];

point2 = plot[[2]][[1, 1]][[1]];

Visualization

{ListPlot[point1], ListPlot[point2]}

Figure 2 There are 3 branches in every plot, and we need one of them

b11 = plot[[1]][[1, 1]][[2, 1, 3]][[1]][[2]][[1]];

Visualization

ListPlot[point1[[b11]]]
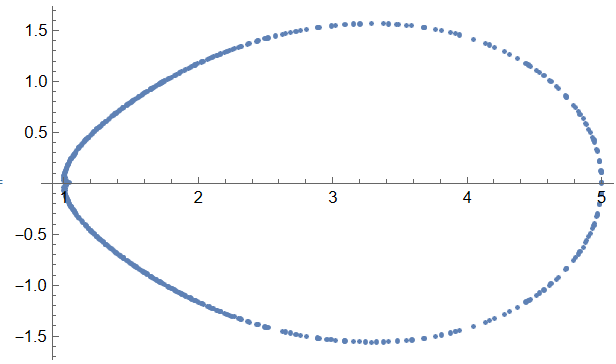
Figure 3

To select roots from points above we use

root = Select[point1[[b11]], Abs[#[[2]]] < 10^-6 &]

(*Out[]= {{5.0054, -1.11022*10^-16}, {1.04057, -1.11022*10^-16}}*)

Visualization

Show[ListPlot[point1[[b11]]], 
 ListPlot[root, PlotStyle -> Red]]
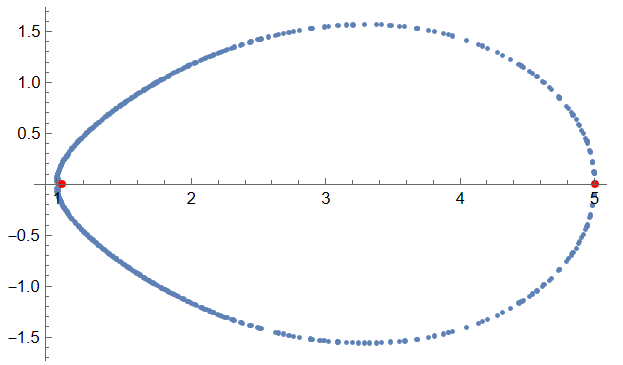
Figure 4

Same steps for plot[[2]]

b21 = plot[[2]][[1, 1]][[2, 1, 3]][[1]][[2]][[1]];

root2 = Select[point2[[b21]], Abs[#[[2]]] < 10^-6 &]

(*Out[]= {{0.0328947, -1.11022*10^-16}, {5.82164, -1.11022*10^-16}}*)

Show[ListPlot[point2[[b21]]], 
 ListPlot[root2, PlotStyle -> Red]]
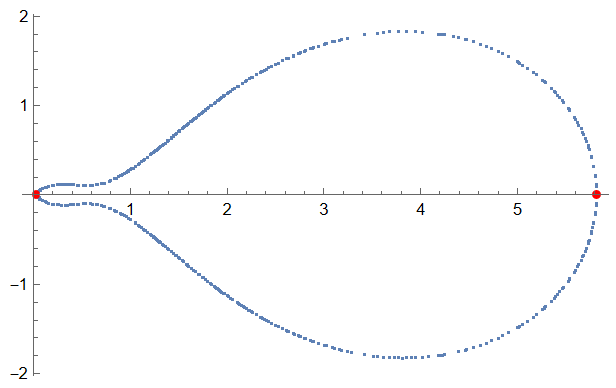
Figure 5

Note, that roots extracted from ContourPlot data are very rough. Nevertheless we can plot Sol2 as function of k as follows

f[x_?NumericQ, y_?NumericQ] := 
 1 - k^2/(x + I y)^2 - 
  5.811300019879834`*^7/k^2 NIntegrate[
    s Sqrt[s^2 - 1] (1 - 
       1/(x + I y) - (s ((1 - 
               1/(x + I y))^2 - (k^2 (s^2 - 
                 1))/(s^2 (x + I y)^2)) (x + 
            I y) ArcTanh[(k Sqrt[
               s^2 - 1])/(s (x + I y - 1))])/(k Sqrt[-1 + 
            s^2])) Exp[-10 s], {s, 1, Infinity}]

plot = Table[
   ContourPlot[{Re@f[x, y] == 0, Im@f[x, y] == 0}, {x, 0, 10}, {y, -2,
      2}, PlotPoints -> 20, 
    FrameLabel -> {TraditionalForm["x"], TraditionalForm["y"]}, 
    GridLines -> Automatic], {k, Range[.01, 4.01, .25]}];

point = Table[plot[[i]][[1, 1]][[1]], {i, Length[plot]}];
b = Table[
   plot[[i]][[1, 1]][[2, 1, 3]][[1]][[2]][[1]], {i, Length[plot]}];
root = Flatten[
  Table[MinimalBy[Select[point[[i]][[b[[i]]]], Abs[#[[2]]] < 10^-6 &],
     First], {i, Length[plot]}], 1];
kr = Range[2, 3, .1]; plot1 = 
 Table[ContourPlot[{Re@f[x, y] == 0, Im@f[x, y] == 0}, {x, 0, 
    10}, {y, -2, 2}, PlotPoints -> 20, 
   FrameLabel -> {TraditionalForm["x"], TraditionalForm["y"]}, 
   GridLines -> Automatic], {k, kr}];

point1 = Table[plot1[[i]][[1, 1]][[1]], {i, Length[plot1]}];
b1 = Table[
   plot1[[i]][[1, 1]][[2, 1, 3]][[1]][[2]][[1]], {i, Length[plot1]}];
 root1 = Flatten[
  Table[MinimalBy[
    Select[point1[[i]][[b[[i]]]], Abs[#[[2]]] < 10^-6 &], First], {i, 
    Length[plot1]}], 1];

Visualization Re[Sol2[k]]

ListPlot[
 Transpose[{Join[Range[.01, 4.01, .25], kr], 
   Join[root[[All, 1]], root1[[All, 1]]]}]] 
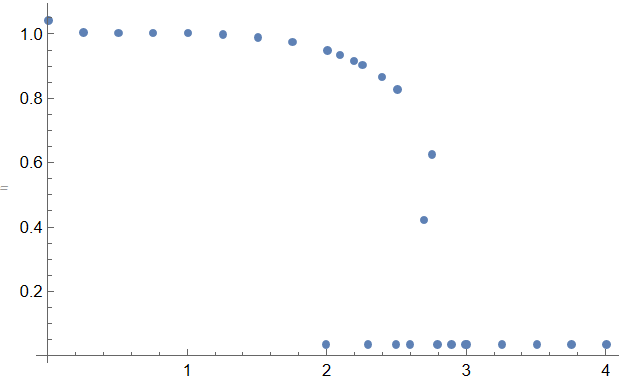
Figure6

Update 1.We can map infinite interval in NIntegrate on the unit interval $(0,1)$ using substitution $s\rightarrow 1/u$. With this substitution we define new function

ftest[k_?NumericQ, z_?NumericQ] := 
 1 - k^2/(z)^2 - 
  Rationalize[5.811300019879834`*^7, 30]/(k^3 z) NIntegrate[(
    E^(-10/u) (k Sqrt[
        1 - u^2] (-1 + z) - (k^2 (-1 + u^2) + (-1 + z)^2) ArcTanh[(
         k Sqrt[1 - u^2])/(-1 + z)]))/u^4, {u, 0, 1}]

In test example function ftest generates same results as f, but about 8 times faster

ftest[1, 1/2] // AbsoluteTiming

Out[]= {0.0086506, 104.563 - 33.2089 I}

Using ftest we can produce this plot

ContourPlot[{Re[ftest[1, x + I y]] == 0, 
   Im[ftest[1, x + I y]] == 0}, {x, .0, .1}, {y, -.1, .1}, 
  PlotPoints -> 25] 
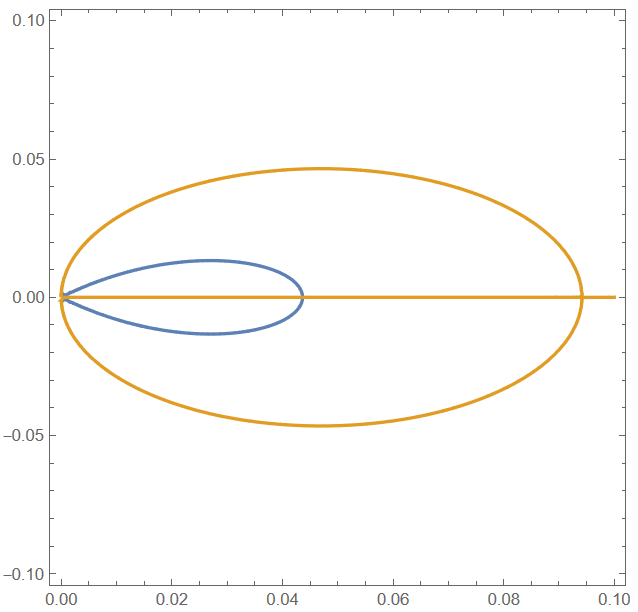
Figure 7

As we can see there is small root Sol2 that we lost in the large scale plot above. Now we can use FindRoot to compute Sol2[k] as follows

 roots = 


Table[{k, 
   z /. Quiet@
     FindRoot[ftest[k, z] == 0, {z, .000001, .001}, 
      Method -> "Secant"]}, {k, .15, .95, .1}]

Out[]= {{0.15, 0.0011195}, {0.25, 0.00309493}, {0.35, 
  0.0060224}, {0.45, 0.00985867}, {0.55, 0.0145452}, {0.65, 
  0.0200069}, {0.75, 0.02615}, {0.85, 0.0328578}, {0.95, 0.0399814}}

We can test quality of this roots as

ftest[#[[1]], #[[2]]] & /@ roots

Out[]= {5.49335*10^-10, -2.29284*10^-9, -2.50111*10^-11, 
 2.72848*10^-12, -7.13953*10^-11, -3.53111*10^-10, -1.4677*10^-10, \
-8.29914*10^-12, -1.13687*10^-13}

Therefore in this interval we have next plot

ListLinePlot[Re[roots], AxesLabel -> {"k", "Re(Sol2)"}]
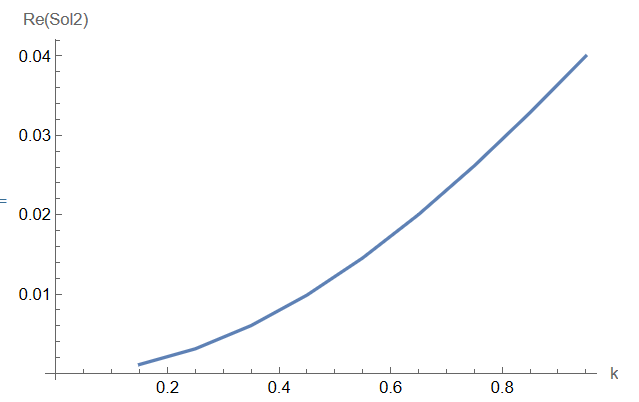
Figure 8

For small k<0.15we can compute roots with Solve using series

Series[(E^(-10/
     u) (k Sqrt[
       1 - u^2] (-1 + z) - (k^2 (-1 + u^2) + (-1 + z)^2) ArcTanh[(
        k Sqrt[1 - u^2])/(-1 + z)]))/u^4, {k, 0, 3}] // Normal

Out[]= -((2 E^(-10/u) k^3 Sqrt[1 - u^2] (-1 + u^2))/(3 u^4 (-1 + z))

Therefore ftest has an asymptotic at k<<1 in the form

fs = 
 1 - k^2/(z)^2 - Rationalize[c  5.811300019879834`*^7, 30]/( z (z - 1))

Out[]= 1 - k^2/z^2 - 20/((-1 + z) z)

Where

c = NIntegrate[-((2  E^(-10/u)   Sqrt[1 - u^2]  (-1 + u^2))/(
   3  (u^4) )), {u, 0, 1}]

Out[]= 3.44925*10^-7 

With this asymptotic we solve roots exactly using Solve

Z = z /. Solve[fs == 0, z]

Out[]= {1/3 - (-61 - 3 k^2)/(
  3 (91 - 9 k^2 + 3 Sqrt[3] Sqrt[-8100 - 1301 k^2 - 58 k^4 - k^6])^(
   1/3)) + 1/
   3 (91 - 9 k^2 + 3 Sqrt[3] Sqrt[-8100 - 1301 k^2 - 58 k^4 - k^6])^(
   1/3), 1/3 + ((1 + I Sqrt[3]) (-61 - 3 k^2))/(
  6 (91 - 9 k^2 + 3 Sqrt[3] Sqrt[-8100 - 1301 k^2 - 58 k^4 - k^6])^(
   1/3)) - 1/
   6 (1 - I Sqrt[3]) (91 - 9 k^2 + 
     3 Sqrt[3] Sqrt[-8100 - 1301 k^2 - 58 k^4 - k^6])^(1/3), 
 1/3 + ((1 - I Sqrt[3]) (-61 - 3 k^2))/(
  6 (91 - 9 k^2 + 3 Sqrt[3] Sqrt[-8100 - 1301 k^2 - 58 k^4 - k^6])^(
   1/3)) - 1/
   6 (1 + I Sqrt[3]) (91 - 9 k^2 + 
     3 Sqrt[3] Sqrt[-8100 - 1301 k^2 - 58 k^4 - k^6])^(1/3)} 

Visualization

Table[Plot[Evaluate[ReIm@Z[[i]]], {k, 0, .15}], {i, Length[Z]}]

Figure 9

Note, that last plot corresponds to roots computed above with FindRoot. Therefore we can test asymptotic at k=0.15

Z[[3]] /. k -> .15

Out[]= 0.00112367 + 1.33227*10^-15 I

And with FindRoot we have 0.0011195038138796902. This asymptotic working nice up to k=0.75 as shown below

Show[Plot[Re@Z[[3]], {k, 0, 1}, AxesLabel -> {"k", "Re(Sol2)"}], 
 ListPlot[roots, PlotStyle -> Red]]
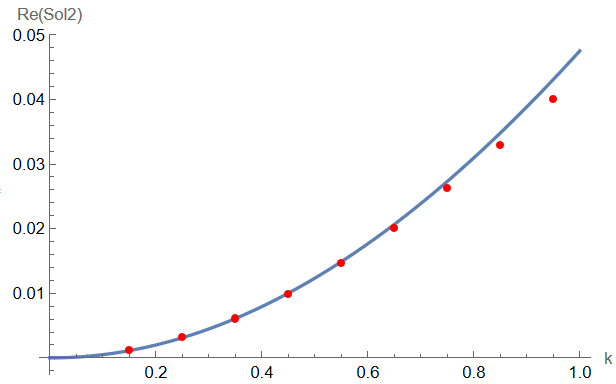
Figure 10

Update 2. We also can compute asymptotic formula at k>>1 as follows

Series[(E^(-10/
     u) (k Sqrt[
       1 - u^2] (-1 + z) - (k^2 (-1 + u^2) + (-1 + z)^2) ArcTanh[(
        k Sqrt[1 - u^2])/(-1 + z)]))/(u^4 k^3), {k, Infinity, 3}] // 
  Normal

Out[]= -((2 E^(-10/u) (-1 + u^2) (-1 + z))/(
  k^2 u^4 Sqrt[1 - u^2])) + (
 E^(-10/u) \[Pi] (-1 + u^2) Sqrt[(
  k^2 (-1 + u^2))/(-1 + z)^2] (-1 + z))/(2 k^2 u^4 Sqrt[1 - u^2]) + (
 E^(-10/u) \[Pi] Sqrt[(k^2 (-1 + u^2))/(-1 + z)^2] (-1 + z)^3)/(
 2 k^4 u^4 Sqrt[1 - u^2])

Therefore ftest has an asymptotic at k>>1` in a form

fl = 
 1 - k^2/(z)^2 - 
  Rationalize[Expand[5.811300019879834`*^7 (c1 + c2 + c3)], 30]/( z)


Out[]= 1 - k^2/z^2 - ((505 I)/k^3 - 250/k^2 - (91 I)/k - (1011 I z)/
  k^3 + (250 z)/k^2 + (505 I z^2)/k^3)/z

Where

c1 = (-1 + z)/
   k^2  NIntegrate[-((2 (E^(-10/u)) (-1 + u^2) )/( 
    u^4  Sqrt[1 - u^2])), {u, 0, 1}]

Out[]= (4.30196*10^-6 (-1 + z))/k^2


c2 = 
 1/k  NIntegrate[((E^(-10/u)) \[Pi]  (-1 + u^2)  Sqrt[(-1 + u^2)] )/(
   2   u^4  Sqrt[1 - u^2]), {u, 0, 1}]

Out[]= -((0. + 1.56891*10^-6 I)/k)


c3 = (-1 + z)^2/
   k^3  NIntegrate[((E^(-10/u))  \[Pi]  Sqrt[(-1 + u^2)] )/(
   2  u^4  Sqrt[1 - u^2]), {u, 0, 1}]

Out[]= ((0. + 8.70031*10^-6 I)  (-1 + z)^2)/k^3

Finally we solve and plot roots at k>2

ZZ = z /. Solve[fl == 0, z];
Table[Plot[Evaluate[ReIm@ZZ[[i]]], {k, 2, 20}], {i, Length[ZZ]}]

Figure 11

$\endgroup$
24
  • 1
    $\begingroup$ @Gallagher Please see update to my answer. $\endgroup$ Commented Mar 9 at 19:29
  • 1
    $\begingroup$ @Gallagher It takes a time to compute data. Could you also try to improve this solution? $\endgroup$ Commented Mar 9 at 19:56
  • 1
    $\begingroup$ @Gallagher How you know this estimation Re[Sol2(k)]<<1? From my solution it follows, that Im[Sol2(k)]<<1. $\endgroup$ Commented Mar 9 at 23:19
  • 1
    $\begingroup$ @Gallagher You are right, see Update 1 to my answer. $\endgroup$ Commented Mar 10 at 12:32
  • 1
    $\begingroup$ No, sign is on since limits of integral also should be swapped. Actually I tested ftest compare to f, they show same result, but ftest is faster. $\endgroup$ Commented Mar 11 at 10:35
2
$\begingroup$

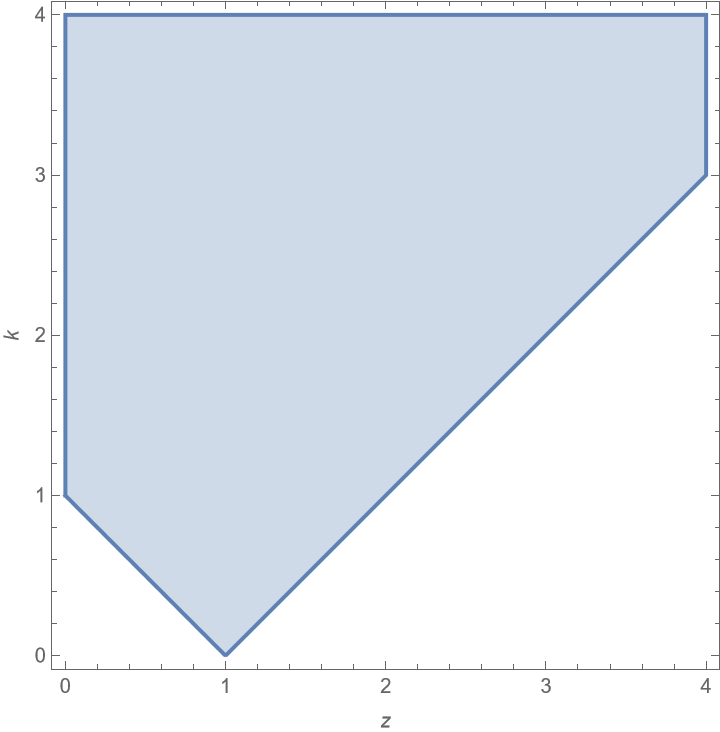
ArcTanh[w] has branch cuts for Abs[w] > 1 && Im[w] == 0. As shown in Alex Trounev's answer, the function presented in the question can be rewritten as ftest, which contains ArcTanh[(k Sqrt[1 - u^2])/(-1 + z)] with u ranging over {0, 1}. Thus, the branch cuts in ArcTanh impact the integral for Abs[k/(-1 + z)] > 1 && Im[z] == 0. This can be visualized by

RegionPlot[Abs[k/(1 - z)] > 1, {z, 0, 4}, {k, 0, 4}, 
    FrameLabel -> {z, k}, PlotPoints -> 100]

enter image description here

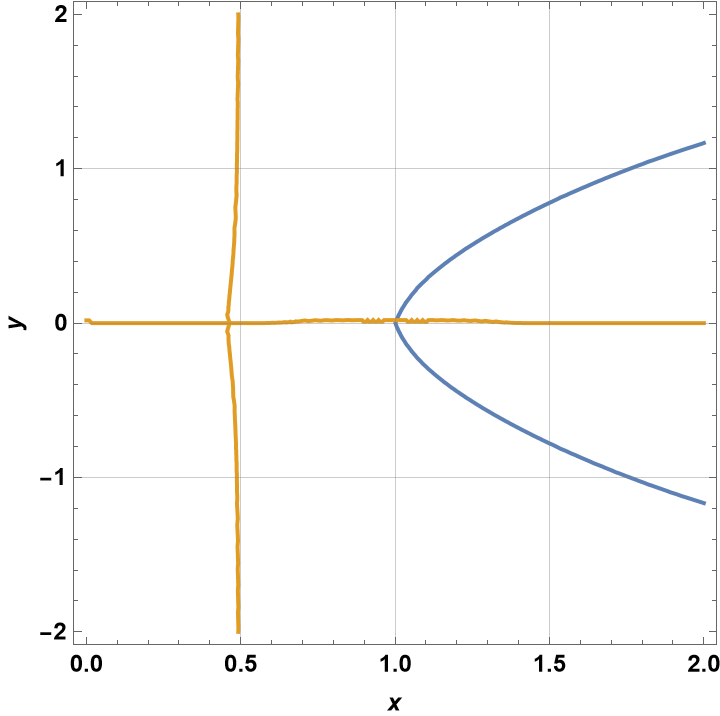
indicating that special care should be taken for real z in the shaded area. To make this more concrete, consider results for k = 0.5, for which the branch cuts could interfere with results for 0.5 < z < 1.5. The corresponding ContourPlot is

ContourPlot[{Re@ftest[.5, x + I  y] == 0, Im@ftest[.5, x + I  y] == 0}, 
    {x, 0, 2}, {y, -2, 2}, GridLines -> Automatic, FrameLabel -> {x, y}, 
    LabelStyle -> {12, Bold, Black}]

enter image description here

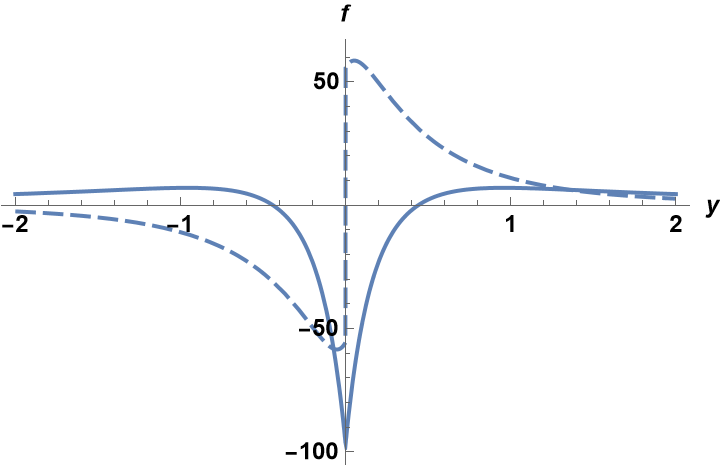
shows y = 0 as a solution to Im@ftest[.5, x + I y] == 0, although the plot looks a bit irregular for 0.6 < x < 1.4. Next, plot

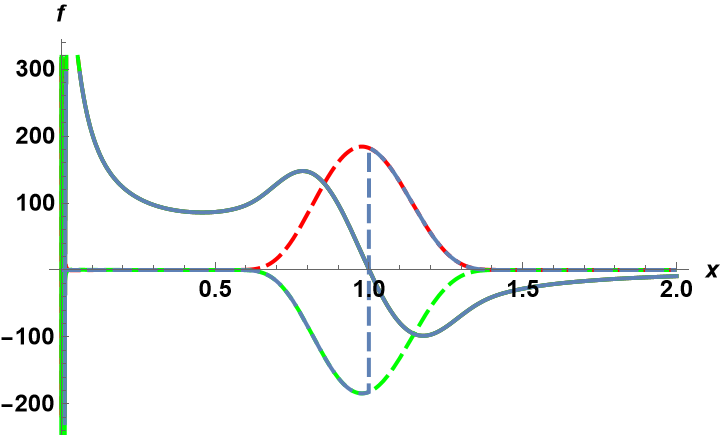
ReImPlot[ftest[.5, 1.2 + I y], {y, -2, 2}, PlotRange -> All, 
    AxesLabel -> {y, f}, ReImStyle -> {Automatic, Dashing[{0.03, 0.01}]},
    LabelStyle -> {12, Bold, Black}]

enter image description here

Similar plots in y for other values of 0.5 < x < 1.5 show similar discontinuities at y = 0, although the discontinuities are much smaller for x at the ends of the range just given. Outside this range, such plots show no discontinuities.

Next, consider plots of constant y very near y = 0.

p2 = ReImPlot[ftest[.5, x + 0.0001*I], {x, 0, 2}, AxesLabel -> {x, f}, 
    PlotStyle -> Red, ReImStyle -> {Automatic, Dashing[{0.03, 0.01}]}, 
    LabelStyle -> {12, Bold, Black}];
p3 = ReImPlot[ftest[.5, x - 0.0001*I], {x, 0, 2}, AxesLabel -> {x, f}, 
    PlotStyle -> Red, ReImStyle -> {Automatic, Dashing[{0.03, 0.01}]}, 
    LabelStyle -> {12, Bold, Black}];
p1 = ReImPlot[ftest[.5, x + 0.0001*I], {x, 0, 2}, AxesLabel -> {x, f}, 
    ReImStyle -> {Automatic, Dashing[{0.03, 0.01}]}, 
    LabelStyle -> {12, Bold, Black}];
Show[p2, p3, p1]

enter image description here

Larger values of constant y show similar behavior for 0.5 < x < 1.5. Thus, y == 0 clearly is not a solution to Im@ftest[.5, x + I y] == 0, contrary to the impression given by the ContourPlot. Perhaps, it is confused by the discontinuities there. All this indicates that solutions to the question lying in the shaded area of the first plot here should not be trusted. Applying this to Alex Tournev's answer suggests that the "Sol1" solutions are correct, but the "Sol2" solutions are incorrect. The solutions for small z given in his update also appear to be correct.

$\endgroup$
2
  • $\begingroup$ It's very clear @bbgodfrey, thank you so much for these details and explanations on branch cuts. Hoping they provide something to resolve this issue. But I have a question, maybe I'm wrong, you say at the end that Alex Tournev's answer suggests that Sol2 solutions are correct, but Sol1 solutions are incorrect, Sol1 is correct, right? $\endgroup$
    – Gallagher
    Commented Mar 18 at 8:34
  • $\begingroup$ @Gallagher Thank you for catching my misstatement. Sol1 solutions are correct, but Sol2 solutions are incorrect. $\endgroup$
    – bbgodfrey
    Commented Mar 18 at 12:45

Your Answer

By clicking “Post Your Answer”, you agree to our terms of service and acknowledge you have read our privacy policy.

Not the answer you're looking for? Browse other questions tagged or ask your own question.