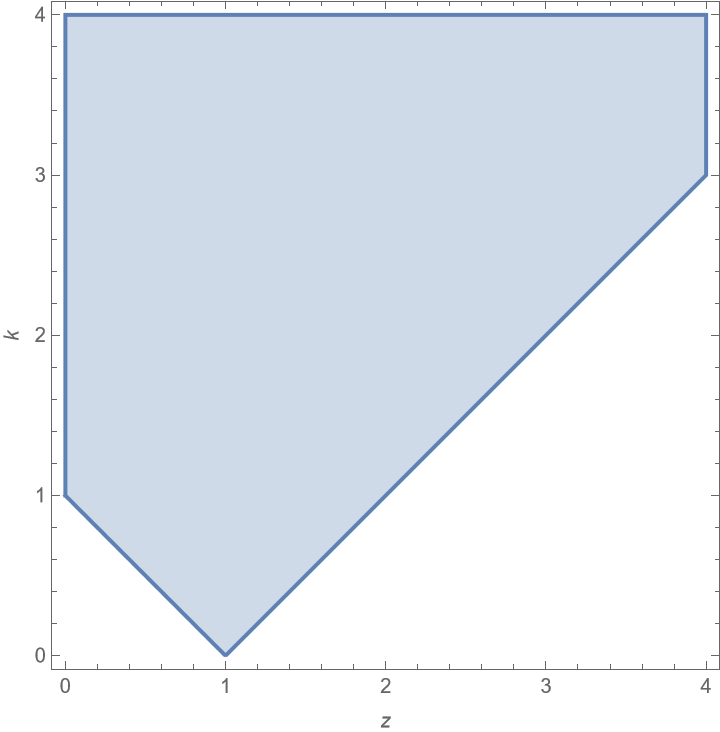
ArcTanh[w] has branch cuts for Abs[w] > 1 && Im[w] == 0. As shown in Alex Trounev's answer, the function presented in the question can be rewritten as ftest, which contains ArcTanh[(k Sqrt[1 - u^2])/(-1 + z)] with u ranging over {0, 1}. Thus, the branch cuts in ArcTanh impact the integral for Abs[k/(-1 + z)] > 1 && Im[z] == 0. This can be visualized by
RegionPlot[Abs[k/(1 - z)] > 1, {z, 0, 4}, {k, 0, 4},
    FrameLabel -> {z, k}, PlotPoints -> 100]

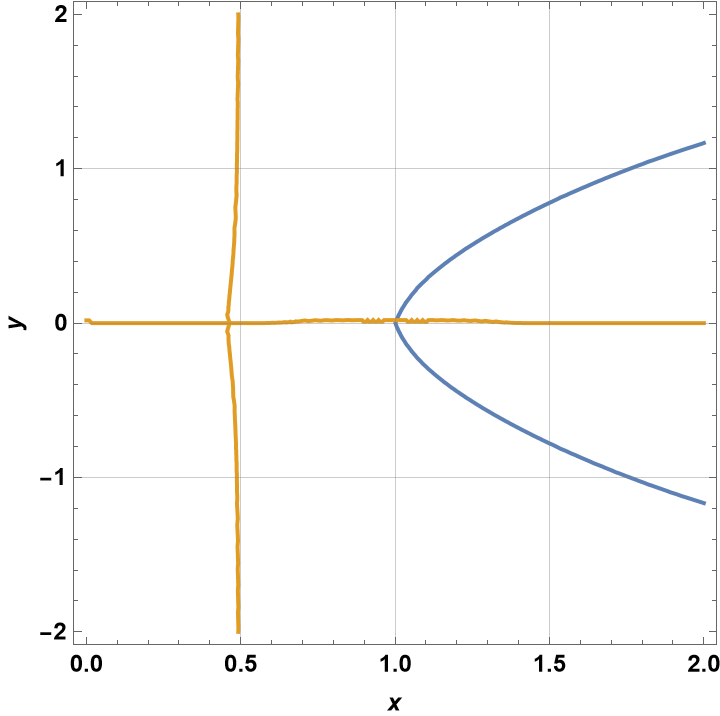
indicating that special care should be taken for real z in the shaded area. To make this more concrete, consider results for k = 0.5, for which the branch cuts could interfere with results for 0.5 < z < 1.5. The corresponding ContourPlot is
ContourPlot[{Re@ftest[.5, x + I  y] == 0, Im@ftest[.5, x + I  y] == 0},
    {x, 0, 2}, {y, -2, 2}, GridLines -> Automatic, FrameLabel -> {x, y},
    LabelStyle -> {12, Bold, Black}]

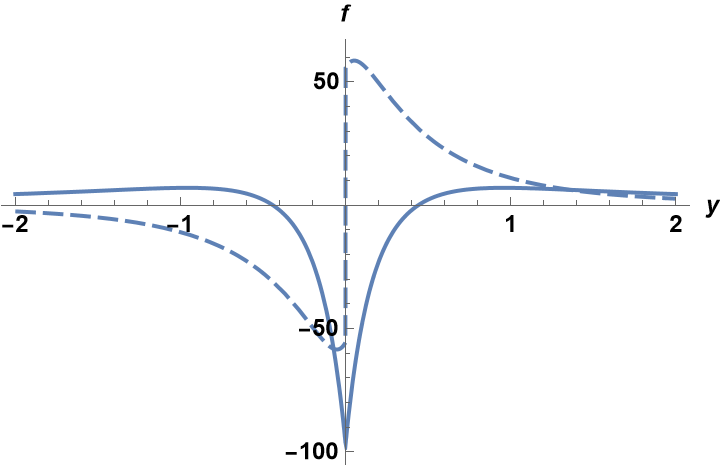
shows y = 0 as a solution to Im@ftest[.5, x + I y] == 0, although the plot looks a bit irregular for 0.6 < x < 1.4. Next, plot
ReImPlot[ftest[.5, 1.2 + I y], {y, -2, 2}, PlotRange -> All,
    AxesLabel -> {y, f}, ReImStyle -> {Automatic, Dashing[{0.03, 0.01}]},
    LabelStyle -> {12, Bold, Black}]

Similar plots in y for other values of 0.5 < x < 1.5 show similar discontinuities at y = 0, although the discontinuities are much smaller for x at the ends of the range just given. Outside this range, such plots show no discontinuities.
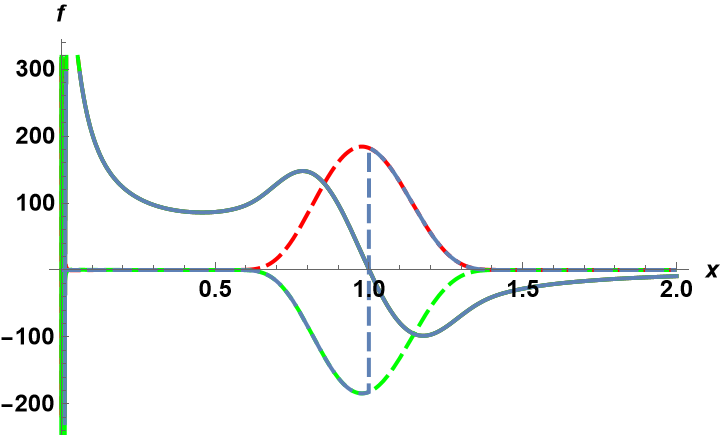
Next, consider plots of constant y very near y = 0.
p2 = ReImPlot[ftest[.5, x + 0.0001*I], {x, 0, 2}, AxesLabel -> {x, f},
    PlotStyle -> Red, ReImStyle -> {Automatic, Dashing[{0.03, 0.01}]},
    LabelStyle -> {12, Bold, Black}];
p3 = ReImPlot[ftest[.5, x - 0.0001*I], {x, 0, 2}, AxesLabel -> {x, f},
    PlotStyle -> Red, ReImStyle -> {Automatic, Dashing[{0.03, 0.01}]},
    LabelStyle -> {12, Bold, Black}];
p1 = ReImPlot[ftest[.5, x + 0.0001*I], {x, 0, 2}, AxesLabel -> {x, f},
    ReImStyle -> {Automatic, Dashing[{0.03, 0.01}]},
    LabelStyle -> {12, Bold, Black}];
Show[p2, p3, p1]

Larger values of constant y show similar behavior for 0.5 < x < 1.5. Thus, y == 0 clearly is not a solution to Im@ftest[.5, x + I y] == 0, contrary to the impression given by the ContourPlot. Perhaps, it is confused by the discontinuities there. All this indicates that solutions to the question lying in the shaded area of the first plot here should not be trusted. Applying this to Alex Tournev's answer suggests that the "Sol2" solutions are correct, but the "Sol1" solutions are incorrect. The solutions for small z given in his update also appear to be correct.


