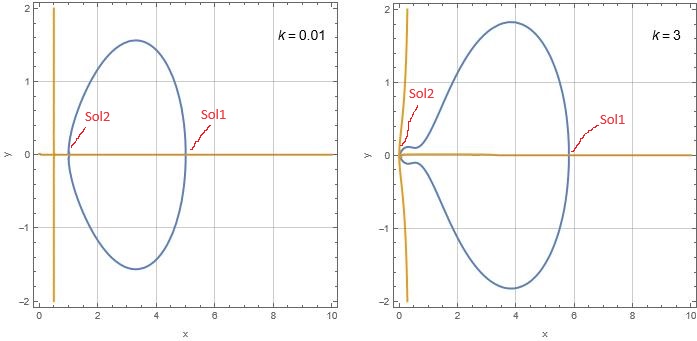
To select points Sol1,Sol2 we use Select at points extracting from ContourPlot as follows
f[x_?NumericQ, y_?NumericQ] :=
 1 - k^2/(x + I  y)^2 -
  5.811300019879834`*^7/k^2  NIntegrate[
    s  Sqrt[s^2 - 1]  (1 -
       1/(x + I  y) - (s  ((1 -
               1/(x + I  y))^2 - (k^2  (s^2 -
                 1))/(s^2  (x + I  y)^2))  (x +
            I  y)  ArcTanh[(k  Sqrt[
               s^2 - 1])/(s  (x + I  y - 1))])/(k  Sqrt[-1 +
            s^2])) Exp[-10 s], {s, 1, Infinity}]

plot = Table[
  ContourPlot[{Re@f[x, y] == 0, Im@f[x, y] == 0}, {x, 0, 10}, {y, -2,
    2}, PlotPoints -> 20,
   FrameLabel -> {TraditionalForm["x"], TraditionalForm["y"]},
   GridLines -> Automatic], {k, {.01, 3}}]
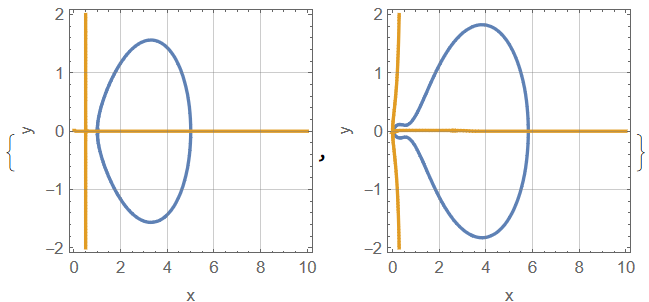
To extract points from plot we use
point1 = plot[[1]][[1, 1]][[1]];

point2 = plot[[2]][[1, 1]][[1]];
Visualization
{ListPlot[point1], ListPlot[point2]}
 There are 3 branches in every plot, and we need one of them
b11 = plot[[1]][[1, 1]][[2, 1, 3]][[1]][[2]][[1]];
Visualization
ListPlot[point1[[b11]]]
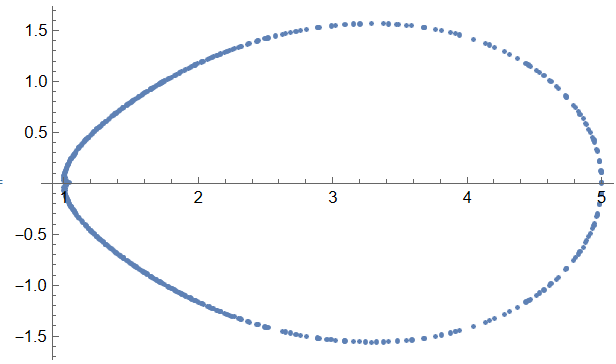
To select roots from points above we use
root = Select[point1[[b11]], Abs[#[[2]]] < 10^-6 &]

(*Out[]= {{5.0054, -1.11022*10^-16}, {1.04057, -1.11022*10^-16}}*)
Visualization
Show[ListPlot[point1[[b11]]],
 ListPlot[root, PlotStyle -> Red]]
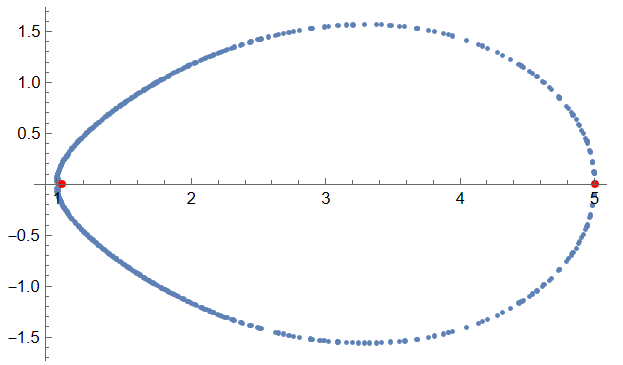
Same steps for plot[[2]]
b21 = plot[[2]][[1, 1]][[2, 1, 3]][[1]][[2]][[1]];

root2 = Select[point2[[b21]], Abs[#[[2]]] < 10^-6 &]

(*Out[]= {{0.0328947, -1.11022*10^-16}, {5.82164, -1.11022*10^-16}}*)

Show[ListPlot[point2[[b21]]],
 ListPlot[root2, PlotStyle -> Red]]
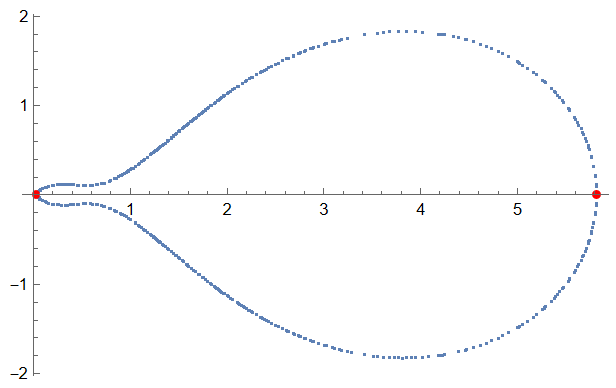
Note, that roots extracted from ContourPlot data are very rough. Nevertheless we can plot Sol2 as function of k as follows
f[x_?NumericQ, y_?NumericQ] :=
 1 - k^2/(x + I y)^2 -
  5.811300019879834`*^7/k^2 NIntegrate[
    s Sqrt[s^2 - 1] (1 -
       1/(x + I y) - (s ((1 -
               1/(x + I y))^2 - (k^2 (s^2 -
                 1))/(s^2 (x + I y)^2)) (x +
            I y) ArcTanh[(k Sqrt[
               s^2 - 1])/(s (x + I y - 1))])/(k Sqrt[-1 +
            s^2])) Exp[-10 s], {s, 1, Infinity}]

plot = Table[
   ContourPlot[{Re@f[x, y] == 0, Im@f[x, y] == 0}, {x, 0, 10}, {y, -2,
      2}, PlotPoints -> 20,
    FrameLabel -> {TraditionalForm["x"], TraditionalForm["y"]},
    GridLines -> Automatic], {k, Range[.01, 4.01, .25]}];

point = Table[plot[[i]][[1, 1]][[1]], {i, Length[plot]}];
b = Table[
   plot[[i]][[1, 1]][[2, 1, 3]][[1]][[2]][[1]], {i, Length[plot]}];
root = Flatten[
  Table[MinimalBy[Select[point[[i]][[b[[i]]]], Abs[#[[2]]] < 10^-6 &],
     First], {i, Length[plot]}], 1];
kr = Range[2, 3, .1]; plot1 =
 Table[ContourPlot[{Re@f[x, y] == 0, Im@f[x, y] == 0}, {x, 0,
    10}, {y, -2, 2}, PlotPoints -> 20,
   FrameLabel -> {TraditionalForm["x"], TraditionalForm["y"]},
   GridLines -> Automatic], {k, kr}];

point1 = Table[plot1[[i]][[1, 1]][[1]], {i, Length[plot1]}];
b1 = Table[
   plot1[[i]][[1, 1]][[2, 1, 3]][[1]][[2]][[1]], {i, Length[plot1]}];
 root1 = Flatten[
  Table[MinimalBy[
    Select[point1[[i]][[b[[i]]]], Abs[#[[2]]] < 10^-6 &], First], {i,
    Length[plot1]}], 1];
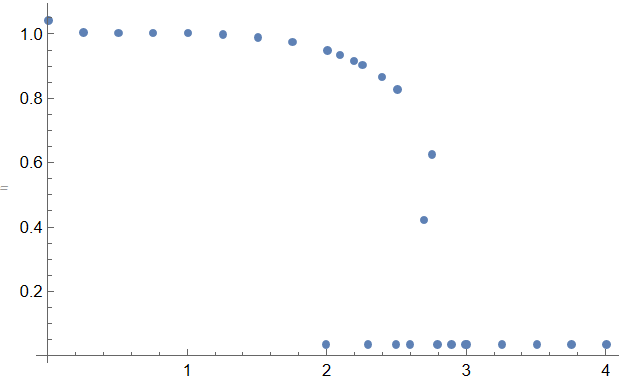
Visualization Re[Sol2[k]]
ListPlot[
 Transpose[{Join[Range[.01, 4.01, .25], kr],
   Join[root[[All, 1]], root1[[All, 1]]]}]]
Update 1.We can map infinite interval in NIntegrate on the unit interval $(0,1)$ using substitution $s\rightarrow 1/u$. With this substitution we define new function
ftest[k_?NumericQ, z_?NumericQ] :=
 1 - k^2/(z)^2 -
  Rationalize[5.811300019879834`*^7, 30]/(k^3 z) NIntegrate[(
    E^(-10/u) (k Sqrt[
        1 - u^2] (-1 + z) - (k^2 (-1 + u^2) + (-1 + z)^2) ArcTanh[(
         k Sqrt[1 - u^2])/(-1 + z)]))/u^4, {u, 0, 1}]
In test example function ftest generates same results as f, but about 8 times faster
ftest[1, 1/2] // AbsoluteTiming

Out[]= {0.0086506, 104.563 - 33.2089 I}
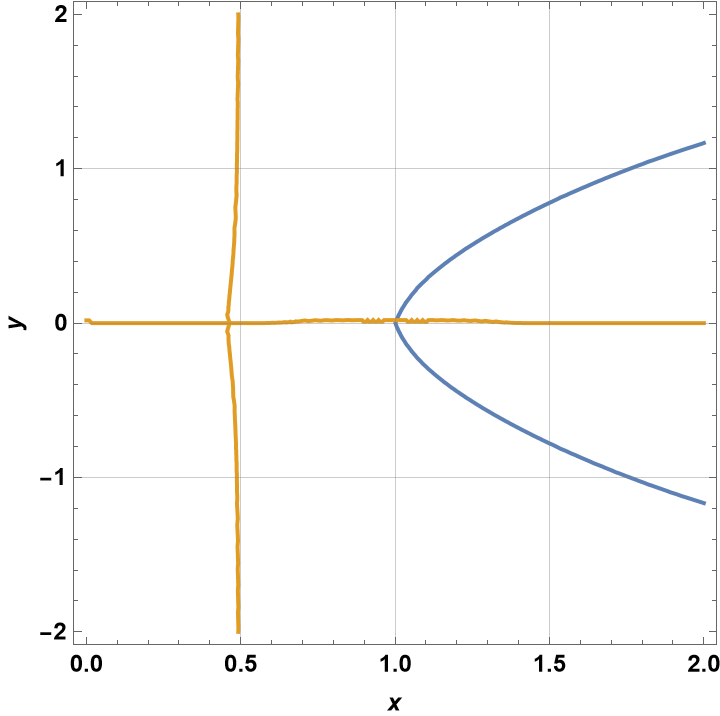
Using ftest we can produce this plot
ContourPlot[{Re[ftest[1, x + I y]] == 0,
   Im[ftest[1, x + I y]] == 0}, {x, .0, .1}, {y, -.1, .1},
  PlotPoints -> 25]
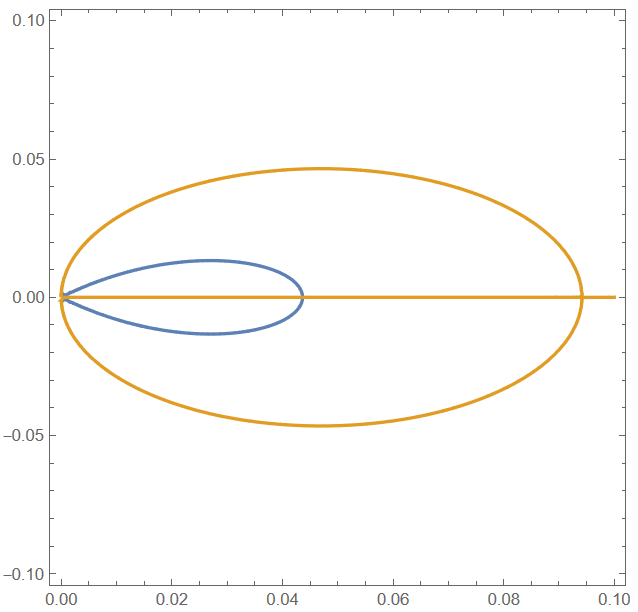
As we can see there is small root Sol2 that we lost in the large scale plot above. Now we can use FindRoot to compute Sol2[k] as follows
 roots =


Table[{k,
   z /. Quiet@
     FindRoot[ftest[k, z] == 0, {z, .000001, .001},
      Method -> "Secant"]}, {k, .15, .95, .1}]

Out[]= {{0.15, 0.0011195}, {0.25, 0.00309493}, {0.35,
  0.0060224}, {0.45, 0.00985867}, {0.55, 0.0145452}, {0.65,
  0.0200069}, {0.75, 0.02615}, {0.85, 0.0328578}, {0.95, 0.0399814}}
We can test quality of this roots as
ftest[#[[1]], #[[2]]] & /@ roots

Out[]= {5.49335*10^-10, -2.29284*10^-9, -2.50111*10^-11,
 2.72848*10^-12, -7.13953*10^-11, -3.53111*10^-10, -1.4677*10^-10, \
-8.29914*10^-12, -1.13687*10^-13}
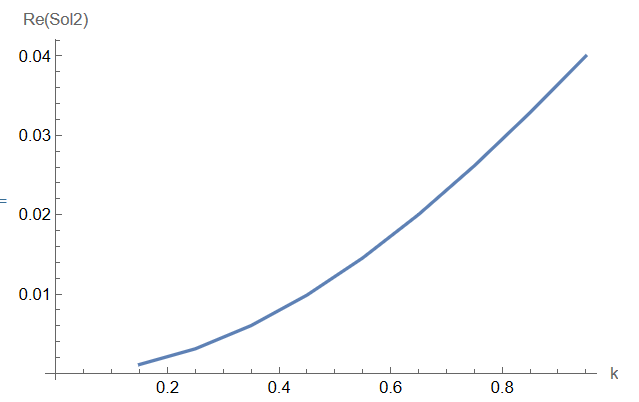
Therefore in this interval we have next plot
ListLinePlot[Re[roots], AxesLabel -> {"k", "Re(Sol2)"}]
For small k<0.15we can compute roots with Solve using series
Series[(E^(-10/
     u) (k Sqrt[
       1 - u^2] (-1 + z) - (k^2 (-1 + u^2) + (-1 + z)^2) ArcTanh[(
        k Sqrt[1 - u^2])/(-1 + z)]))/u^4, {k, 0, 3}] // Normal

Out[]= -((2 E^(-10/u) k^3 Sqrt[1 - u^2] (-1 + u^2))/(3 u^4 (-1 + z))
Therefore ftest has an asymptotic at k<<1 in the form
fs =
 1 - k^2/(z)^2 - Rationalize[c  5.811300019879834`*^7, 30]/( z (z - 1))

Out[]= 1 - k^2/z^2 - 20/((-1 + z) z)
Where
c = NIntegrate[-((2  E^(-10/u)   Sqrt[1 - u^2]  (-1 + u^2))/(
   3  (u^4) )), {u, 0, 1}]

Out[]= 3.44925*10^-7
With this asymptotic we solve roots exactly using Solve
Z = z /. Solve[fs == 0, z]

Out[]= {1/3 - (-61 - 3 k^2)/(
  3 (91 - 9 k^2 + 3 Sqrt[3] Sqrt[-8100 - 1301 k^2 - 58 k^4 - k^6])^(
   1/3)) + 1/
   3 (91 - 9 k^2 + 3 Sqrt[3] Sqrt[-8100 - 1301 k^2 - 58 k^4 - k^6])^(
   1/3), 1/3 + ((1 + I Sqrt[3]) (-61 - 3 k^2))/(
  6 (91 - 9 k^2 + 3 Sqrt[3] Sqrt[-8100 - 1301 k^2 - 58 k^4 - k^6])^(
   1/3)) - 1/
   6 (1 - I Sqrt[3]) (91 - 9 k^2 +
     3 Sqrt[3] Sqrt[-8100 - 1301 k^2 - 58 k^4 - k^6])^(1/3),
 1/3 + ((1 - I Sqrt[3]) (-61 - 3 k^2))/(
  6 (91 - 9 k^2 + 3 Sqrt[3] Sqrt[-8100 - 1301 k^2 - 58 k^4 - k^6])^(
   1/3)) - 1/
   6 (1 + I Sqrt[3]) (91 - 9 k^2 +
     3 Sqrt[3] Sqrt[-8100 - 1301 k^2 - 58 k^4 - k^6])^(1/3)}
Visualization
Table[Plot[Evaluate[ReIm@Z[[i]]], {k, 0, .15}], {i, Length[Z]}]

Note, that last plot corresponds to roots computed above with FindRoot. Therefore we can test asymptotic at k=0.15
Z[[3]] /. k -> .15

Out[]= 0.00112367 + 1.33227*10^-15 I
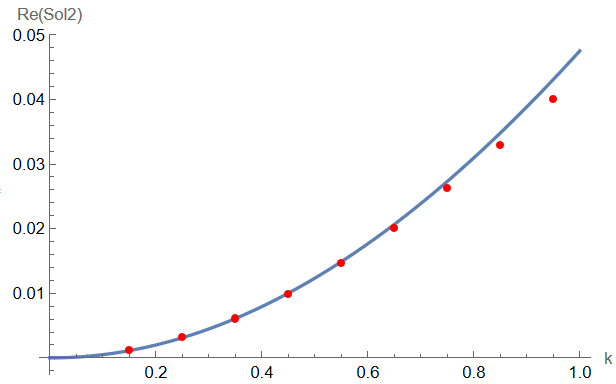
And with FindRoot we have 0.0011195038138796902. This asymptotic working nice up to k=0.75 as shown below
Show[Plot[Re@Z[[3]], {k, 0, 1}, AxesLabel -> {"k", "Re(Sol2)"}],
 ListPlot[roots, PlotStyle -> Red]]
Update 2. We also can compute asymptotic formula at k>>1 as follows
Series[(E^(-10/
     u) (k Sqrt[
       1 - u^2] (-1 + z) - (k^2 (-1 + u^2) + (-1 + z)^2) ArcTanh[(
        k Sqrt[1 - u^2])/(-1 + z)]))/(u^4 k^3), {k, Infinity, 3}] //
  Normal

Out[]= -((2 E^(-10/u) (-1 + u^2) (-1 + z))/(
  k^2 u^4 Sqrt[1 - u^2])) + (
 E^(-10/u) \[Pi] (-1 + u^2) Sqrt[(
  k^2 (-1 + u^2))/(-1 + z)^2] (-1 + z))/(2 k^2 u^4 Sqrt[1 - u^2]) + (
 E^(-10/u) \[Pi] Sqrt[(k^2 (-1 + u^2))/(-1 + z)^2] (-1 + z)^3)/(
 2 k^4 u^4 Sqrt[1 - u^2])
Therefore ftest has an asymptotic at k>>1` in a form
fl =
 1 - k^2/(z)^2 -
  Rationalize[Expand[5.811300019879834`*^7 (c1 + c2 + c3)], 30]/( z)


Out[]= 1 - k^2/z^2 - ((505 I)/k^3 - 250/k^2 - (91 I)/k - (1011 I z)/
  k^3 + (250 z)/k^2 + (505 I z^2)/k^3)/z
Where
c1 = (-1 + z)/
   k^2  NIntegrate[-((2 (E^(-10/u)) (-1 + u^2) )/(
    u^4  Sqrt[1 - u^2])), {u, 0, 1}]

Out[]= (4.30196*10^-6 (-1 + z))/k^2


c2 =
 1/k  NIntegrate[((E^(-10/u)) \[Pi]  (-1 + u^2)  Sqrt[(-1 + u^2)] )/(
   2   u^4  Sqrt[1 - u^2]), {u, 0, 1}]

Out[]= -((0. + 1.56891*10^-6 I)/k)


c3 = (-1 + z)^2/
   k^3  NIntegrate[((E^(-10/u))  \[Pi]  Sqrt[(-1 + u^2)] )/(
   2  u^4  Sqrt[1 - u^2]), {u, 0, 1}]

Out[]= ((0. + 8.70031*10^-6 I)  (-1 + z)^2)/k^3
Finally we solve and plot roots at k>2
ZZ = z /. Solve[fl == 0, z];
Table[Plot[Evaluate[ReIm@ZZ[[i]]], {k, 2, 20}], {i, Length[ZZ]}]




MeshFindIntersections[plot], then feeding the results toFindRootto refine the roots. It doesn't seem to work for your difficult points, though. $\endgroup$