3
$\begingroup$

I have a dataset written below. I need to find a rational function that best fits this data set. How can I do it using Mathematica?

The answer should be: $$f(t)=(2.196t^5+2.27t^4+2.013t^3+0.9592t^2+0.2953t+0.05070)/(768.6t^6+1249t^5+1154t^4+712.9t^3+307.6t^2+89.05t+15.29). $$

Data: Constraints for fitting: f(0)=0.0032; f(t->Infinty)=0.0029/t

  t,  f(t)    
  0,  0.0033157279810811526  
  1,  0.0018295674601849948  
  2,  0.001131312601917103  
  3,  0.0008137831218081155  
  4,  0.000634477850153065  
  5, 0.0005196386646717525  
  6, 0.00043989323618322913   
  7, 0.0003813202240932608  
  8, 0.0003364891929679466  
  9, 0.0003010778932330931  
  10,  0.0002724027569571278  
  11, 0.00024871026460566477  
  12, 0.00022880647172520942  
  13,  0.00021185043578976072  
  14,  0.00019723280821218295  
  15, 0.00018450128323486335  
  16,  0.00017331309019417618  
  17, 0.00016340374128199977  
  18, 0.000154565898127803   
  19, 0.00014663473181380346  
  20,  0.00013947756268911104  
  21,  0.0001329863885107969  
  22, 0.00012707240339959042  
  23, 0.00012166191521331618  
  24, 0.00011669326214520721    
$\endgroup$
10
  • $\begingroup$ It would be helpful if you could give the full answer. $\endgroup$
    – JimB
    Commented Jan 25 at 15:17
  • $\begingroup$ @JimB I have updated the answer. Thank you. $\endgroup$ Commented Jan 25 at 16:17
  • $\begingroup$ Thank you for adding that. I'd also be curious about the reference because the question you should have is why anyone would attempt to fit 13 parameters with 24 data points. @Domen ' s answer with n=1; m=2 (5 parameters) gives an almost perfect fit (and nearly identical predictions as with n=2; m=2). $\endgroup$
    – JimB
    Commented Jan 25 at 17:22
  • $\begingroup$ You are correct; I only provided a few data points here. However, I have worked with a total of 300 data points, and the results do not align with @Domen's answer. I am uncertain about where I may have made a mistake. The reference for my work is arxiv.org/abs/1603.08694v1. In this paper, the data points are generated by solving equations (30) and (31), and the functions I have written correspond to equation (35). $\endgroup$ Commented Jan 25 at 18:11
  • $\begingroup$ If the 300 data points provide just a "denser" set of points, then I would say that the paper should have had a statistical review (from a statistician and not a physicist). A rational function with $n=5$ and $n=6$ can result in a lot bumpier shape than what appears from a plot of the function you present. What one sees is a relatively smooth curve with no need for lots of parameters. Looking at the estimated correlation matrix (fit("CorrelationMatrix")//TableForm) shows many, many entries near 1 or -1 which implies (or actually yells out) overparameterization. $\endgroup$
    – JimB
    Commented Jan 25 at 19:05

1 Answer 1

7
$\begingroup$

Assume the degree of the numerator is n and that of the denominator is m. Then we can make a rational fit using "NonlinearModelFit" like e.g.:

dat = Partition[{0, 0.003315727981081152, 1, 0.0018295674601849948, 2,
     0.001131312601917103, 3, 0.0008137831218081155, 4, 
    0.000634477850153065, 5, 0.0005196386646717525, 6, 
    0.00043989323618322913, 7, 0.0003813202240932608, 8, 
    0.0003364891929679466, 9, 0.0003010778932330931, 10, 
    0.0002724027569571278, 11, 0.00024871026460566477, 12, 
    0.00022880647172520942, 13, 0.00021185043578976072, 14, 
    0.00019723280821218295, 15, 0.00018450128323486335, 16, 
    0.00017331309019417618, 17, 0.00016340374128199977, 18, 
    0.000154565898127803, 19, 0.00014663473181380346, 20, 
    0.00013947756268911104, 21, 0.0001329863885107969, 22, 
    0.00012707240339959042, 23, 0.00012166191521331618, 24, 
    0.00011669326214520721}, 2];

n = 2; m = 2;
vara = Array[a, n + 1, 0]
varb = Array[b, m + 1, 0];

fit = NonlinearModelFit[dat, 
  vara . Table[x^i, {i, 0, n}]/varb . Table[b[i]  x^i, {i, 0, m}], 
  Join[vara, varb], x]

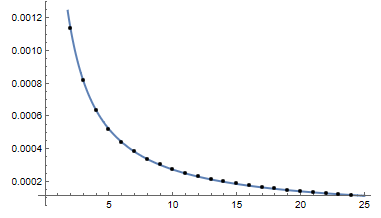
Plot[{fit[x]}, {x, 0, 25}, Epilog -> Point[dat]]

enter image description here

$\endgroup$
7
  • $\begingroup$ Thank you. The question is to find the functional form of f(t). $\endgroup$ Commented Jan 25 at 11:22
  • 2
    $\begingroup$ You get this by fit // Normal $\endgroup$ Commented Jan 25 at 11:24
  • 2
    $\begingroup$ Or alternatively fit[x] $\endgroup$ Commented Jan 25 at 11:32
  • 1
    $\begingroup$ You have 2 parameters: n and m that may be different. $\endgroup$ Commented Jan 25 at 12:35
  • 1
    $\begingroup$ I think that typically either $a_0$ or $b_0$ is set to 1 for such models. That removes an unnecessary parameter (one less parameter to estimate and the resulting parameter estimators are more stable). However, the predictions will still be the same (at least if one ignores differences in rounding errors). $\endgroup$
    – JimB
    Commented Jan 26 at 5:05

Your Answer

By clicking “Post Your Answer”, you agree to our terms of service and acknowledge you have read our privacy policy.

Not the answer you're looking for? Browse other questions tagged or ask your own question.