12
$\begingroup$

I have a set of data coordinates which is mostly compatible with an Ellipsoid:

{{x1,y1,z1},{x2,y2,z2}, ... , {xn,yn,zn}}

Now I want to find the best 3d volume that fits this data ( a 3D shape that passes closest to these data ).

I know how to use Fit command for one dimensional data but don't know how to do that in 3D.

$\endgroup$
1

4 Answers 4

9
$\begingroup$

I am not sure what the exact aim is and time does not permit refining some loose ends. Assuming reason to believe data is ellipsoid (as test data is):

Using test data from another answer:

data = Flatten[
   Table[{RandomReal[{1.9, 2.1}] Cos[n/100 2 Pi] Sin[m/100 Pi], 
     RandomReal[{0.9, 1.1}] Sin[n/100 2 Pi] Sin[m/100 Pi], 
     RandomReal[{0.9, 1.1}] Cos[m/100 Pi]}, {m, 100}, {n, 100}], 1];

Fit:

model = {#1^2, #2^2, #1, #2, #3, #1 #2, #1 #3, #2 #3, #3^2} & @@@ data;
lmf = LinearModelFit[
  model, {1, x2, y2, x, y, z, xy, xz, yz}, {x2, y2, x, y, z, xy, xz, 
   yz}]
fun[u_, v_, w_] := 
 lmf["BestFitParameters"].{1, u^2, v^2, u, v, w, u v, u w, v w}

Volume:

reg = ImplicitRegion[fun[x, y, z] > z^2, {x, y, z}];
dreg = DiscretizeRegion[reg];
Volume[reg]

yields: 8.45783

See original answer for graphics and examples of model properties. Only difference data used.

Original Answer (based on misunderstanding)

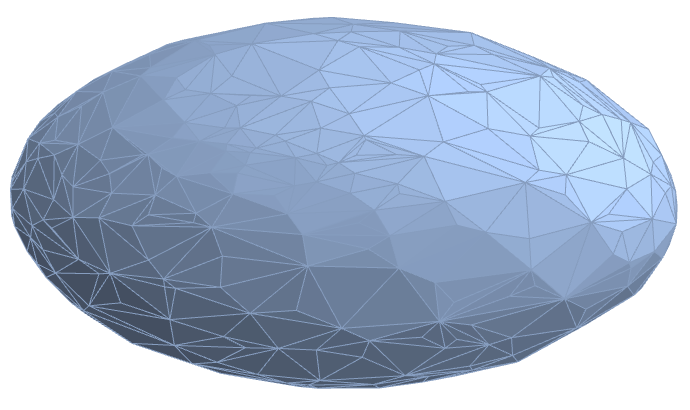
ConvexHullMesh provides an enclosing convex volume:

ch = ConvexHullMesh[data]
enter image description here

Fitting:

chv = ch["VertexCoordinates"];
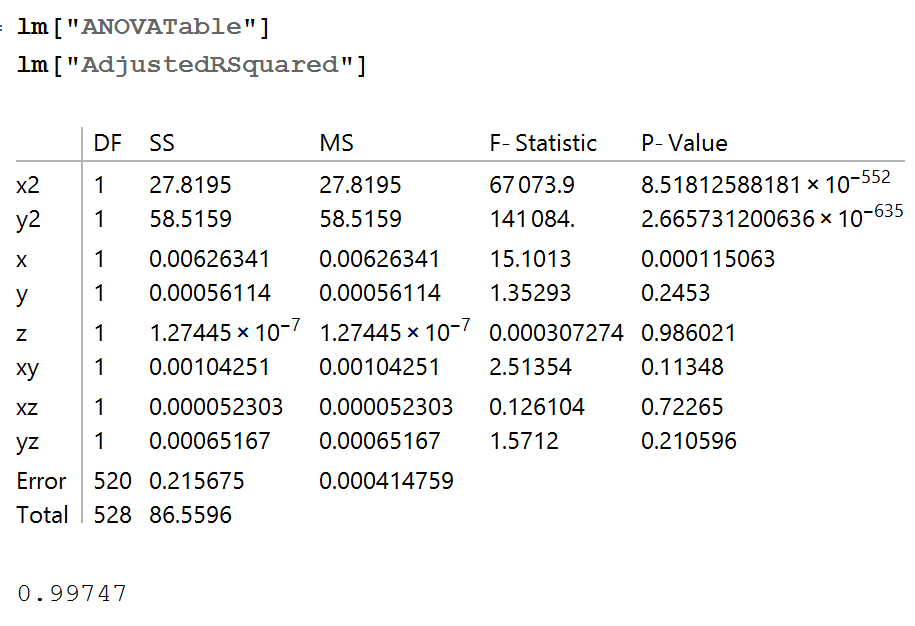
mod = {#1^2, #2^2, #1, #2, #3, #1 #2, #1 #3, #2 #3, #3^2} & @@@ chv;
lm = LinearModelFit[
  mod, {1, x2, y2, x, y, z, xy, xz, yz}, {x2, y2, x, y, z, xy, xz, 
   yz}]
f[u_, v_, w_] := 
 lm["BestFitParameters"].{1, u^2, v^2, u, v, w, u v, u w, v w}

The model is reasonable and (as how data generated implies) suggests dropping cross and translation terms (I won't do for time sake).
enter image description here

Show[ContourPlot3D[
  f[u, v, w] - w^2 == 0, {u, -2, 2}, {v, -2, 2}, {w, -2, 2}, 
  Mesh -> False, ContourStyle -> Opacity[0.3]], 
 Graphics3D[Point[data]]]
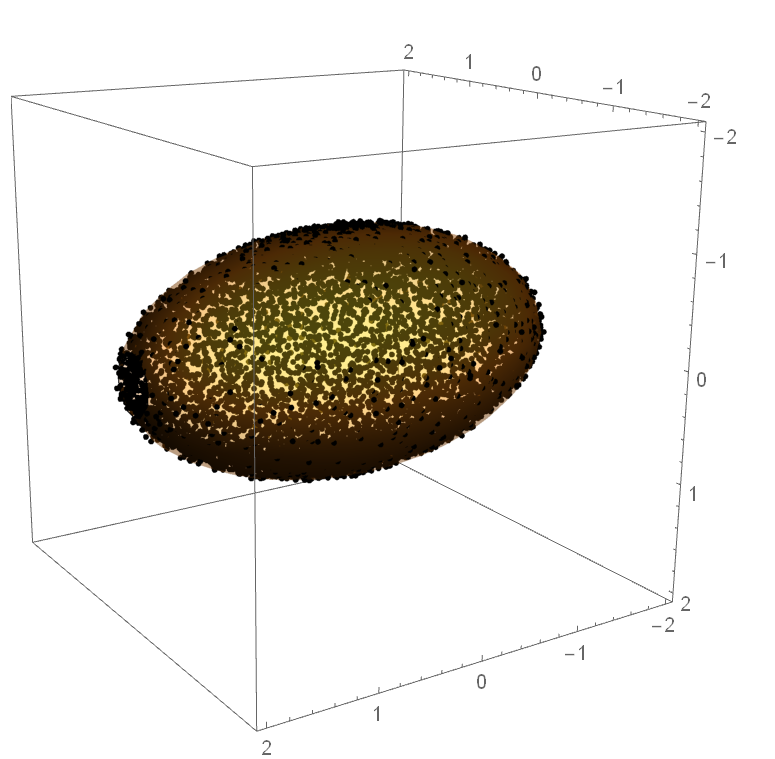
enter image description here

The equation: 1.17889 + 0.00294153 x - 0.277082 x2 - 0.00261799 xy - 0.000551349 xz - 0.00163403 y - 1.01096 y2 - 0.00399276 yz + 0.0000264809 z=z^2.

Again, this could clearly be simplified but I do not have time to reduce/simplify model.

Volume of region can be determined in a number of ways: , e.g. Volume[ch] yields: 9.95036

ir = ImplicitRegion[f[x, y, z] > z^2, {x, y, z}]
DiscretizeRegion[ir]
Volume[DiscretizeRegion[ir]]

yields: 9.91025.

This is larger than volume of ellipsoid (2,1,1) and is really fit of convex hull. This, again, is fitting ellipsoid by creating convex hull mesh from data points. The intent of the question may have been for more complex data sets in shape and convex hull may not be ideal.

$\endgroup$
8
  • 1
    $\begingroup$ I think you forgot the definition of f. Also, why not apply LinearModelFit directly to the data points rather than to the vertices of the convex hull? $\endgroup$
    – user484
    Commented Apr 25, 2015 at 3:02
  • $\begingroup$ @Rahul thank you 'cut and paste' error have amended now. I transformed the data to allow use of linear model and to deal with translated and rotated ellipsoids (not relevant in this case), i.e. general quadric surface and avoid non-linear model fit. $\endgroup$
    – ubpdqn
    Commented Apr 25, 2015 at 3:11
  • $\begingroup$ Thanks for fixing the error! Sorry my question was unclear. I understand the quadratic transformation of the data, what I want to know is why you are working with only the subset of the data that lies on the convex hull. If I construct mod using data instead of chv it works fine and I get a better estimate of the volume. $\endgroup$
    – user484
    Commented Apr 25, 2015 at 3:41
  • 1
    $\begingroup$ @Rahul...I should have looked more carefully at test data...it is only the 'shell' with noise so I should have used all the data! I stupidly thought it was points randomly distributed bounded by ellipse...will update when I get time! Yes use ALL the data...thanks $\endgroup$
    – ubpdqn
    Commented Apr 25, 2015 at 3:51
  • 1
    $\begingroup$ @Aug yes a version 10 functionality...sorry for not being explicit $\endgroup$
    – ubpdqn
    Commented Apr 26, 2015 at 2:17
6
$\begingroup$

This is not very Mathematica style, but it will do the job.

We start with a trial data set which is confined in an ellipsoid

data = 
 Flatten[
  Table[
   {RandomReal[{1.9, 2.1}] Cos[n/100 2 Pi] Sin[m/100 Pi], 
    RandomReal[{0.9, 1.1}] Sin[n/100 2 Pi] Sin[m/100 Pi],
    RandomReal[{0.9, 1.1}] Cos[m/100 Pi]}, 
   {m, 100}, {n, 100}], 1];

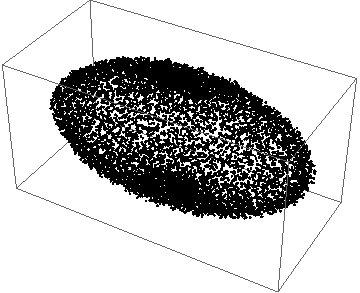
Graphics3D[Point[data]]
Mean[data]

enter image description here

{0.000349362, -0.000145455, -0.00919064}

First we figure out the range of the data

{x1, x2} = {Min[data[[All, 1]]], Max[data[[All, 1]]]}
{y1, y2} = {Min[data[[All, 2]]], Max[data[[All, 2]]]}
{z1, z2} = {Min[data[[All, 3]]], Max[data[[All, 3]]]}

Then we select the upper and lower surface by choosing the Max and Min for a small xy area with side d

d = 0.05;
sdat = 
 Flatten[
  Table[
   dat1 = 
    Select[data,
     x - d/2 <=  #[[1]] < x + d/2 && y - d/2 <= #[[2]] < y + d/2 &];
  {x, y, Min[dat1[[All, 3]]], Max[dat1[[All, 3]]]},
  {x, x1, x2,d}, {y, y1, y2, d}], 1];

up = 
 Select[sdat[[All, {1, 2, 4}]], 0 <= #[[3]] <= z2 &];
dn = 
 Select[sdat[[All, {1, 2, 3}]], z1 <= #[[3]] < 0 &];

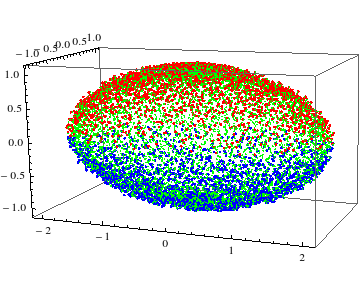
Graphics3D[
 {Red, Point[up], Blue, Point[dn], 
  PointSize[Small], Green,  Point[data]},
 Axes -> True]

enter image description here

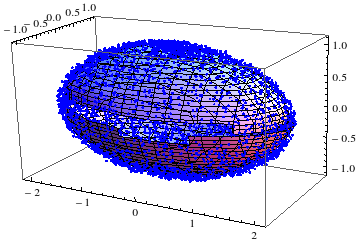
Or use ListSurfacePlot3D for better vissualisation.

Show[
 ListSurfacePlot3D[up],
 ListSurfacePlot3D[dn],
 Graphics3D[{Blue, Point[data]}]
]

enter image description here

Since you have the surfaces you can do anything with them. you can use Interpolation if you need a function for the surfaces.

Volume

You can use Interpolation

gup = Interpolation[up];
vup = NIntegrate[gup[x, y], {x, x1, x2}, {y, y1, y2}]

gdn = Interpolation[dn];
vdn = NIntegrate[gdn[x, y], {x, x1, x2}, {y, y1, y2}]

Abs[vup] + Abs[vdn]

3.98669

-4.03046

8.01715

The "-" sign comes due to the way we choose the limits. These are the volume of upper and lower part. Total volume is their sum - that's all.

The volume of an ellipsoid is $\frac43 \pi a b c$. If you roughly consider $a = 2$ and $b=c=1$, then it is 8.37758.

Not bad, right!

Comment

I made a small mistake earlier in defining up and dn. I corrected it now. As a result you can see the volume is closer to the actual result.

$\endgroup$
2
  • $\begingroup$ That looks great ! Is there any way to calculate its volume and surface also ? $\endgroup$
    – Aug
    Commented Apr 24, 2015 at 22:28
  • $\begingroup$ Thanks @ShutaoTang for the edit. It looks much better. $\endgroup$
    – Sumit
    Commented Apr 25, 2015 at 9:23
2
$\begingroup$

Here's sample data:

testdata = {{2, 0, 0}, {-2, 0, 0}, {0, 1, 0}, {0, -1, 0}, {0, 0, 
    5}, {0, 0, -5}, {1, 1, 4}, {2, 4, -3}};

Here's the covariance matrix:

myCov = Covariance[testdata];

Here's the solution (z value) for a best-fit ellipse:

mysols = Solve[{x, y, z}.Transpose[myCov].myCov.{x, y, z} == 5, z]

{{z -> (17119 x + 51177 y - 
    8 Sqrt[89161135 - 67267296 x^2 - 131440176 x y - 96338312 y^2])/
   363923}, {z -> (
   17119 x + 51177 y + 
    8 Sqrt[89161135 - 67267296 x^2 - 131440176 x y - 96338312 y^2])/
   363923}}

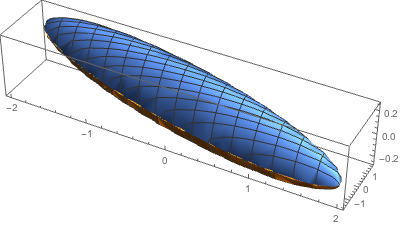
Here's a plot of the solution ellipse:

myellipse = ParametricPlot3D[
  {{x, y, (
    17119 x + 51177 y - 
     8 Sqrt[89161135 - 67267296 x^2 - 131440176 x y - 96338312 y^2])/
    363923},
   {x, y, (
    17119 x + 51177 y + 
     8 Sqrt[89161135 - 67267296 x^2 - 131440176 x y - 96338312 y^2])/
    363923}}, 
  {x, -6, 6}, {y, -6, 6}, 
  BoxRatios -> {5, 1, 1},
  ImageSize -> 400]

enter image description here

$\endgroup$
1
$\begingroup$

Fit can be used for this purpose.

Here is some data in three dimensions:

data = {{0, 0, 0}, {1, 0, 1}, {0, 1, 2}, {1, 1, 0}, {1/2, 1/2, 1}}; 

Find the plane that best fits the data:

plane = Fit[data, {1, x, y}, {x, y}]

enter image description here

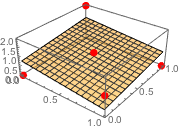
Show the plane with the data points:

Show[Plot3D[plane,  {x, 0, 1}, {y, 0, 1}, PlotStyle -> Opacity[.5], 
 PlotRange -> {0, 2}], 
 Graphics3D[{Red, PointSize[0.05], Map[Point, data]}]]    

enter image description here

Find the quadratic that best fits the data:

 quad = Fit[data, {1, x, y, x^2, x y, y^2}, {x, y}]

enter image description here

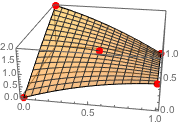
The quadratic actually interpolates the data:

 Show[Plot3D[quad,  {x, 0, 1}, {y, 0, 1}, PlotStyle -> Opacity[.5], 
 PlotRange -> {0, 2}], 
Graphics3D[{Red, PointSize[0.05], Map[Point, data]}]] 

enter image description here

$\endgroup$
2
  • 1
    $\begingroup$ I don't think this will work with an ellipse because an ellipse is not a single-valued function of $x$ and $y$. $\endgroup$ Commented Apr 24, 2015 at 19:59
  • $\begingroup$ Yeah, I just noticed that--I'm going to look into it more. $\endgroup$
    – andrewmh20
    Commented Apr 24, 2015 at 20:00

Your Answer

By clicking “Post Your Answer”, you agree to our terms of service and acknowledge you have read our privacy policy.

Not the answer you're looking for? Browse other questions tagged or ask your own question.