My code runs well up to the final two lines:
analytic[n_, m_, t_] :=
 1/2 (KroneckerDelta[n, m] + (-1)^m *(I)^(n - m)*BesselJ[n - m, 2 t])

matrix[l_, t_] := Table[analytic[n, m, t], {n, l}, {m, l}]

diagonal[l_, t_] := Eigenvalues[matrix[l, t]]

S[l_, t_] := -(Sum[
    diagonal[l, t][[j]] Log[
       diagonal[l, t][[j]]] + (1 - diagonal[l, t][[j]])*
      Log[1 - diagonal[l, t][[j]]], {j, 1, l}])

xdata = Range[0.1, 1, 0.1]

ydata[l_] := S[l, xdata]

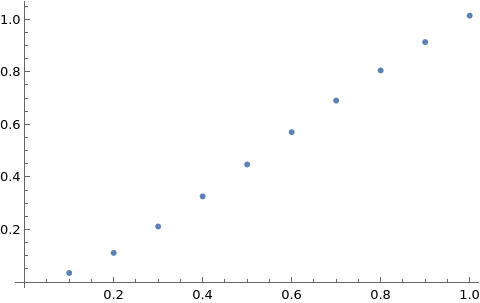
plot[l_] := ListPlot[Transpose[{xdata, ydata[l]}]]
It has a real problem with ydata. I can't even get the dimensions of this list (or at least what should be a list), let alone transpose the two lists. However, a simple scatter graph like
xdata = Range[0, 2 Pi, Pi/6]

ydata[x_, y_] := Sin[xdata + x] + y

plot[x_, y_] := ListPlot[Transpose[{xdata, ydata[x, y]}]]

plot[1, 1]
works no problem and I can't see the difference with what I've done here. I'm new to Mathematica and would really appreciate some help with this!

