3
$\begingroup$

I am trying to Contour plot the solutions "$x$" of an equation versus $k$ for some fixed $T$ values. However, the contour plot is giving incorrect plot perhaps due to some accuracy issues. e.g., at small $T$ ($T\leq 1$) I should get three solutions, but I am not getting three on the contour plot.? The code:

eq[x_, k_, T_] := -Sin[3*k + x]/Sin[2*k + x] + z + 2*Cos[k] + T^2 + (A*T^2*Sin[k]^2)/(Sin[2*k + x]^2 + B*T^4*Sin[k]^2) ==  0 /. {A -> 1/2, B -> 0.00001, z -> -2.37}
ContourPlot[Evaluate[eq[x, k, 0.1]], {x, 0, Pi}, {k, 0, Pi}]
$\endgroup$
6
  • 1
    $\begingroup$ You say three, but I get six: NSolve[{eq[x, k, 1/10] /. x -> 1.5, 0 < k < Pi}, k, WorkingPrecision -> 16] $\endgroup$
    – Michael E2
    Commented Jul 25, 2019 at 0:21
  • 1
    $\begingroup$ Close, but distinct: wp = 100; k0 = k /. NSolve[{eq[x, k, 1/10] == 0 /. x -> x0, 0 < k < Pi}, k, WorkingPrecision -> wp]; ListLinePlot[ Table[ eq[1, k, 1/10], {k, k0[[2]] - 1*^-7, k0[[2]] + 1*^-7, 1*^-9}], GridLines -> {k0, None}, DataRange -> {k0[[2]] - 1*^-7, k0[[2]] + 1*^-7}] --- ListLinePlot[ Table[ eq[1, k, 1/10], {k, k0[[3]] - 1*^-7, k0[[3]] + 1*^-7, 1*^-9}], GridLines -> {k0, None}, DataRange -> {k0[[3]] - 1*^-7, k0[[3]] + 1*^-7}] $\endgroup$
    – Michael E2
    Commented Jul 25, 2019 at 1:09
  • $\begingroup$ @MichaelE2 Thanks for your elaborations. Actually x are the sought solutions (a phase to be found between $0\leq x\leq \pi$). You fixed it to x=1.5, When I replace xwith k I get the three solutions for each fixed k: cf. NSolve[{eq[x, k, 1/10] /. k -> 1.5, 0 < x < Pi}, x, WorkingPrecision -> 16] $\endgroup$
    – AtoZ
    Commented Jul 25, 2019 at 7:00
  • 1
    $\begingroup$ Oops, my bad. Excuse me. I was paying more attention to the ContourPlot, and thinking you were solving for k as a function of x (and I was getting six lines), than to what you wrote. I get only three roots $x$ for $k(x) = k_0$, as well. The problem with ContourPlot is that two of solutions are too close to be resolved by the typical sampling density of ContourPlot, which finds curves by sign changes. The plot should still look like the plot in my answer, but, as you can see, two solutions overlap each other at normal image resolution. $\endgroup$
    – Michael E2
    Commented Jul 25, 2019 at 15:15
  • 1
    $\begingroup$ I updated my answer. I'm not sure entirely what you would like. I think I explained why ContourPlot failed. Theoretically, ContourPlot should start to resolve the roots with PlotPoints -> 3000 ($\Delta x \approx 0.0005-0.005$, interval length $\pi \approx 3$), maybe considerably less, but that's a prohibitive computation for my laptop. And you would need to make the image roughly 3000 pixels wide, or zoom in. Please look at my answer, and if there's something you'd like me to show you, I'll try. $\endgroup$
    – Michael E2
    Commented Jul 25, 2019 at 16:04

3 Answers 3

3
$\begingroup$

It appears that the solution of x -> 2.94159 that you mention in a comment in @Hugh 's answer is incorrect (or maybe better said as "inappropriate"). (@Hugh 's answer essentially says it all.)

That particular solution is really at a discontinuity. If you plug in $\pi-2/10$ for $x$ (i.e., essentially what x -> 2.94159 means), you'll get

Error message

Consider a slight change in your equation (rationalizing the constants and removing the ==0):

eq[x_, k_, T_] := -Sin[3*k + x]/Sin[2*k + x] + z + 2*Cos[k] + 
   T^2 + (A*T^2*Sin[k]^2)/(Sin[2*k + x]^2 + B*T^4*Sin[k]^2) /.
  {A -> 1/2, B -> 10^-5, z -> -237/100}

Then we have

eq[x, 1/10, 1]

equation result

If $\pi-2/10$ is substituted for $x$, then $\csc \left(x+\frac{1}{5}\right)$ results in ComplexInfinity:

Csc[1/5 + x] /. x -> π - 2/10

ComplexInfinity

So, in short, there are only two contour lines of zero, not three, when $T=0.1$.

Oooops! I guess there are more than two contours. See @MichaelE2 's answer.

Addition

In general we have for eq[x,k,T]

general equation

The discontinuity occurs when Csc[2 k + x] is ComplexInfinity or whenever $2k+x=\pi$ or $2k+x=2\pi$ no matter what the value of $T$ happens to be for the ranges of interest of $x$ and $k$. So you could always include those (dotted) lines of discontinuity to your contour plots: Animated contour plots
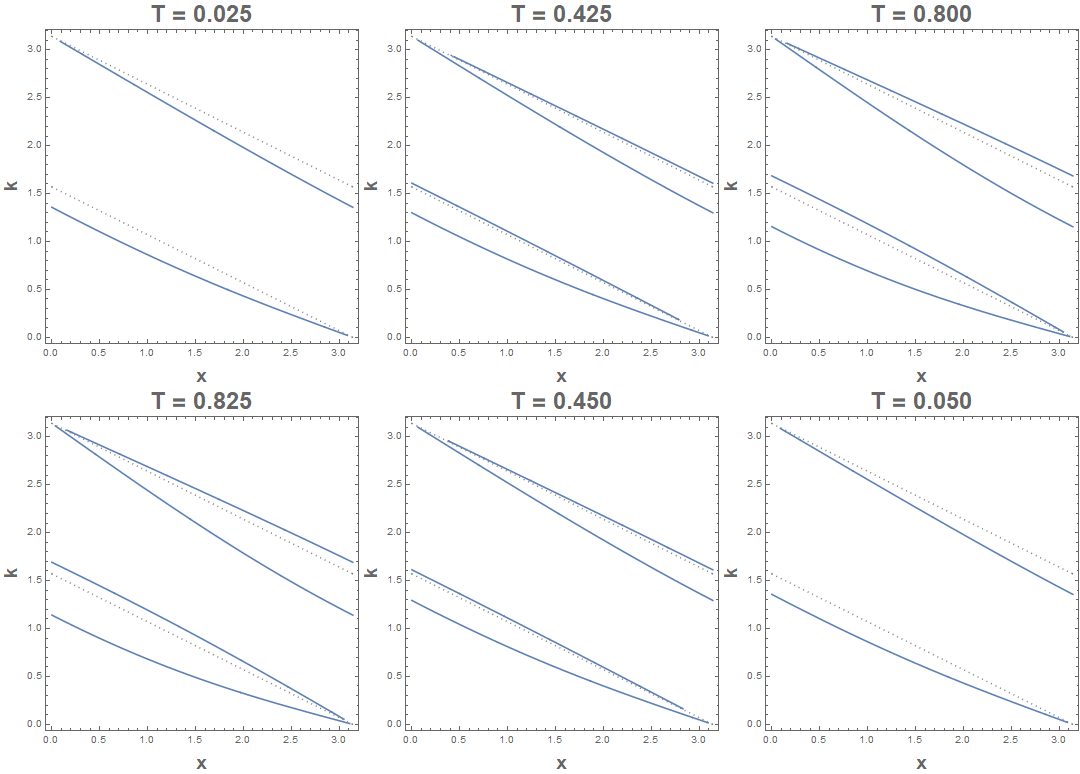
Here is the code to produce the animated contour plot:

t = {"0.025", "0.050", "0.075", "0.100", "0.125", "0.150", "0.175", "0.200", "0.225",
   "0.250", "0.275", "0.300", "0.325", "0.350", "0.375", "0.400", "0.425", "0.450",
   "0.475", "0.500", "0.525", "0.550", "0.575", "0.600", "0.625", "0.650", "0.675",
   "0.700", "0.725", "0.750", "0.775", "0.800", "0.825", "0.850", "0.875", "0.900",
   "0.925", "0.950", "0.975", "1.000"};
eq[x_, k_, T_] := -Sin[3*k + x]/Sin[2*k + x] + z + 2*Cos[k] + 
  T^2 + (A*T^2*Sin[k]^2)/(Sin[2*k + x]^2 + B*T^4*Sin[k]^2) /. {A -> 1/2, B -> 10^-5, z -> -237/100}
g = Table[Show[ContourPlot[Evaluate[eq[x, k, T/40] == 0], {x, 0, π}, {k, 0, π},
     PlotPoints -> 100, AspectRatio -> 1, 
     FrameLabel -> (Style[#, Bold, 18] &) /@ {"x", "k"},
     PlotLabel -> Style["T = " <> t[[T]], Bold, 24]],
    Plot[{π/2 - x/2, π - x/2}, {x, 0, π}, 
     PlotRange -> {{0, π}, {0, π}}, AspectRatio -> 1,
     PlotStyle -> {{Gray, Dotted}}]], {T, 40}];
Export["contours.gif", Flatten[{g, Table[g[[i]], {i, Length[g], 2, -1}]}],
 "DisplayDurations" -> 0.25, AnimationRepetitions -> Infinity]
$\endgroup$
2
  • $\begingroup$ Thanks. How did you create the above plot, with the dotted lines of discontinuity? May I see? $\endgroup$
    – AtoZ
    Commented Jul 25, 2019 at 8:12
  • $\begingroup$ Thank you very much ! $\endgroup$
    – AtoZ
    Commented Jul 26, 2019 at 20:25
5
$\begingroup$

Not an answer but if you do

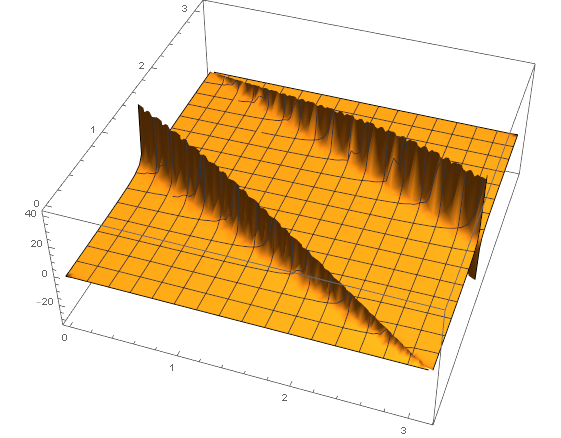
Plot3D[Evaluate[eq[x, k, 0.1]], {x, 0, Pi}, {k, 0, Pi}, 
 PlotRange -> All]

Mathematica graphics

Division by the sin function has zeros which dominate the plot. What are you hoping for?

$\endgroup$
1
  • $\begingroup$ Thanks. When employing the numerical solution by sol[T_?NumericQ, k_ /; 0 <= k <= Pi] := x /. NSolve[{eq[x, k, T], 0 <= x <= Pi}, x, Reals] sol[1, 0.1] for example gives solution for $T=1$, $k=0.1$, which is {2.64172, 2.94159, 2.98454} i.e., three solutions. But on the contour plot, I see only two? $\endgroup$
    – AtoZ
    Commented Jul 24, 2019 at 17:20
4
$\begingroup$

Update: I misread the OP and counted the six distinct function for $k(x)$ as solutions. The OP was trying to solve equations of the form $k(x) = k_0$, for which I get only three solutions for $0 < k_0 < \pi$, just as expected. ContourPlot has a rather weak ability to resolve roots/curves that are close together. It detects solutions via sign changes, and to detect a pair of roots it has to sample the function between them; otherwise, there would be no sign change and ContourPlot will assume there are no solutions there.

I proposed the NDSolve method below as an alternative to ContourPlot. One can use the power of NSolve to resolve the roots, and NDSolve can trace roots throughout the domain. If preferred, one could switch the dependent and independent variables and solve for x[k] as a function of k. There is a discontinuity at k = Pi/2 and one would have to solve twice, once for each of the domains 0 < k < Pi/2 and Pi/2 < k < Pi (or one could integrate over {x, 0, 2 Pi} and use Mod[x, Pi] to construct the solutions over the lower domain.

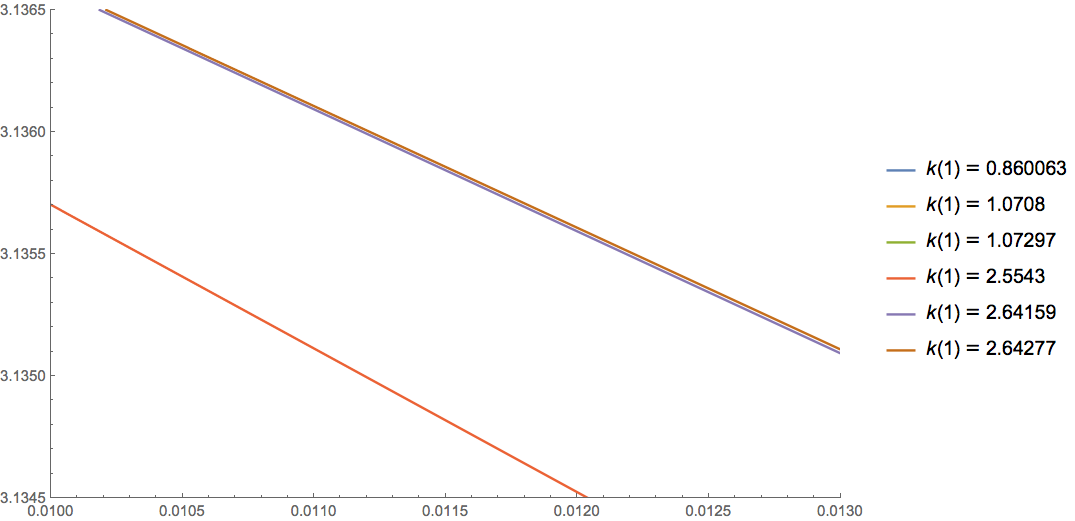
For instance, one can zoom in with PlotRange and show the three roots around $k_0 = 3.1355$:

enter image description here


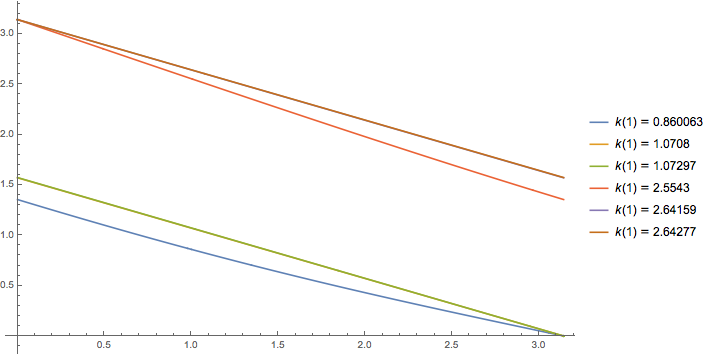
I find six distinct solutions functions $k(x)$ for T = 1/10 at high working precision:

eq[x_, k_, T_] := -Sin[3*k + x]/Sin[2*k + x] + z + 2*Cos[k] + 
    T^2 + (A*T^2*Sin[k]^2)/(Sin[2*k + x]^2 + B*T^4*Sin[k]^2) /.
    {A -> 1/2, B -> 1/100000, z -> -237/100};
x0 = 1;
wp = 100;   (* working precision *)
k0 = k /. NSolve[{eq[x, k, 1/10] == 0 /. x -> x0, 0 < k < Pi},  (* six roots *)
    k, WorkingPrecision -> wp];
Quiet[
  ndsol = First@NDSolve[{
        D[eq[x, k[x], 1/10], x] == 0,
        k[x0] == #},
       k, {x, 0, Pi},
       PrecisionGoal -> 20, WorkingPrecision -> wp] & /@ k0,
  {Power::infy, Infinity::indet}];
k["Domain"] /. ndsol // N
(*  messages Power::infy, Infinity::indet, NDSolve::ndsz,... omitted  *)
(*  Domains of solutions:
  {{{0., 3.14159}}, {{0., 3.14159}}, {{0., 3.14159}},
   {{8.10181*10^-99, 3.14159}}, {{4.85285*10^-55, 3.14159}},
   {{7.61263*10^-99, 3.14159}}}
*)

ListLinePlot[k /. ndsol, PlotLegends -> Thread[k[x0] == N@k0], ImageSize -> Large]

enter image description here

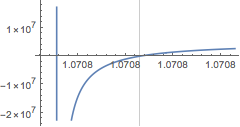
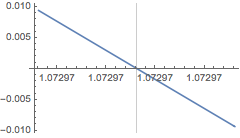
Two pair are close to each other but distinct. For instance:

ListLinePlot[
 Table[
  eq[1, k, 1/10], {k, k0[[2]] - 1*^-7, k0[[2]] + 1*^-7, 1*^-9}], 
 GridLines -> {k0, None}, 
 DataRange -> {k0[[2]] - 1*^-7, k0[[2]] + 1*^-7}]

ListLinePlot[
 Table[
  eq[1, k, 1/10], {k, k0[[3]] - 1*^-7, k0[[3]] + 1*^-7, 1*^-9}], 
 GridLines -> {k0, None}, 
 DataRange -> {k0[[3]] - 1*^-7, k0[[3]] + 1*^-7}]

enter image description here enter image description here

$\endgroup$
3
  • 1
    $\begingroup$ My last numerical analysis class was 45 years ago so please bear with me. I'm thinking that a zero doesn't occur at k = k0[[2]]. k0[[2]] is essentially $\frac{1}{2} (\pi -1)$ (a point of discontinuity). This is what the following plot tells me: Show[Plot[eq[1, k, 1/10], {k, 1, 1.2}, PlotPoints -> 1000, PlotRange -> {{1.06, 1.08}, {-100, 1000}}, MaxRecursion -> 5, WorkingPrecision -> 100], ListPlot[{{{k0[[2]], 0}, {k0[[2]], 1000}}, {{k0[[3]], 0}, {k0[[3]], 1000}}}, Joined -> True, PlotStyle -> {Red, Green}, PlotLegends -> {"k0[[2]]", "k0[[3]]"}]]. $\endgroup$
    – JimB
    Commented Jul 25, 2019 at 3:36
  • 1
    $\begingroup$ @JimB The picture is not perfectly clear (to me), and the appearance of the roots k0[[2]], k0[[3]] may even both be spurious. But the roots are definitely there for the exact parameters I used. They are also stable under perturbations of the parameters {A -> 1/2 (1 + eA), B -> 1/100000 (1 + eB), z -> -237/100 (1 + ez), T -> 1/10 (1 + eT)} for eA, eB, ez, eT up to ±10^-3 (k0[[2]] is about $8 \times 10^{-8}$ above $(\pi-1)/2$). I think what is happening is that as T -> 0, both x0[[2]] and x0[[3]] approach $(\pi-1)/2$. But I suspect they are distinct roots for T > 0. $\endgroup$
    – Michael E2
    Commented Jul 25, 2019 at 4:41
  • $\begingroup$ Thanks. Mathematics is not my strong point. I'll look at it and what you wrote in the comment. $\endgroup$
    – JimB
    Commented Jul 25, 2019 at 4:44

Your Answer

By clicking “Post Your Answer”, you agree to our terms of service and acknowledge you have read our privacy policy.

Not the answer you're looking for? Browse other questions tagged or ask your own question.