4
$\begingroup$

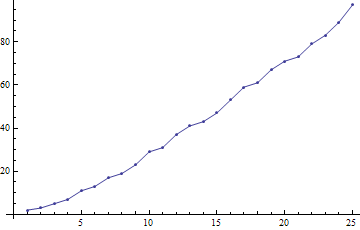
Please consider the following examples for a ListLinePlot and ListPlot

data=Prime[Range[25]];
lstlinePlot=ListLinePlot[data];
lstPlot=ListPlot[Tooltip@data];

Displaying plot-values

As I would like to give the user the chance to retrieve plot-values directly from the plot, I thought to overlay lstlinePlot with lstPlot, whereas for the latter the plot-values are displayed via Tooltip:

res=Show[{lstlinePlot,lstPlot}]

To evaluate two plots based on the same data seems to me rather time consuming. I wonder whether there is a more efficient way to make the plot-values available as via Tooltip (I thought of enabling a "display modus" within Mesh but this does not seem to exist.)

Retrieving plot-data directly from plot

It would be nice to be able to click on the line of lstlinePlot, press the copy shortcut (e.g. cmd+c) and paste the data into another notebook or into a txt-file (as plain text maybe). I know how to retrieve data from a plot (e.g. lstlinePlot[[1, 1, 3, 2, 1, All, 2]]) but I would like to make data available via copy-paste.

$\endgroup$

3 Answers 3

8
$\begingroup$

For the first question, J.M. provided this code which works nicely:

ListPlot[Tooltip /@ Prime[Range[25]], Joined -> True, Mesh -> All]

enter image description here

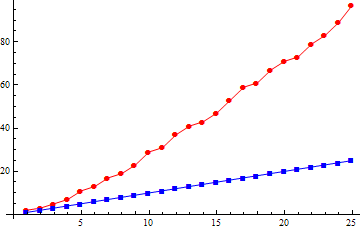
An alternative approach is to use ListLinePlot with PlotMarkers, which allows the points to have the same colour as the lines when there are multiple lines:

plot = ListLinePlot[Tooltip /@ {Prime[Range[25]], Range[25]}, 
  PlotStyle -> {Red, Blue}, PlotMarkers -> Automatic]

enter image description here

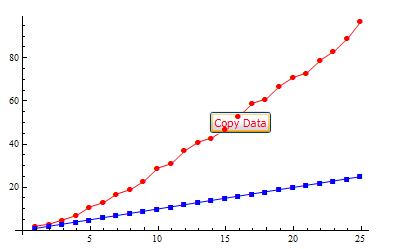
Regarding your second point: I don't know how to override the standard copy-paste in the front end, but here is a code snippet which will make a "Copy Data" button appear when you hover over a line in the plot and press the Control button on the keyboard:

Normal[plot] /. Line[data__] :> Dynamic[
   If[CurrentValue["MouseOver"] && CurrentValue["ControlKey"],
    {Line[data],
     Inset[Button["Copy Data", CopyToClipboard[data]],
      MousePosition["Graphics"]]}, Line[data]]]

enter image description here

I added the "ControlKey" trigger to prevent flickering between the Tooltip and Button displays. The Normal is needed to convert GraphicsComplex expressions to standard graphics primitives, so that the copied data is the actual coordinates rather than the GraphicsComplex indices.

$\endgroup$
6
  • $\begingroup$ Maybe it would be best if you copy my answer into yours, and then I will delete my answer, so that your answer is the complete one... $\endgroup$ Commented Nov 23, 2012 at 0:17
  • $\begingroup$ @SimonWoods The behaviour of the button is a bit strange. It does not change its colour immediately when I touch another line. (Maybe my Mac is reacting to slow?) $\endgroup$
    – John
    Commented Nov 23, 2012 at 2:04
  • $\begingroup$ @John, see my edit - I think this is much improved now. $\endgroup$ Commented Nov 23, 2012 at 10:28
  • $\begingroup$ @J.M., done, thanks. This should probably have been two separate questions really. $\endgroup$ Commented Nov 23, 2012 at 10:29
  • $\begingroup$ @SimonWoods Two more things I did not mentioned before: (1) It would be nice to have the button to appear above the line and (2) if the button touches one of the PlotMarkers Clipboard should only copy the corresponding data-point. $\endgroup$
    – John
    Commented Nov 26, 2012 at 15:58
2
$\begingroup$

This answer was inspired by Alexei Boulbitch's idea of using a locator, but implements it in what I think is a more user friendly way. The locator and its visible marker are constrained to the data points plotted. The user need only click near the point that he/she wants copied to the clipboard and the locator will jump to that point. The argument determining whether or not the plot is joined had been made optional with True as the default.

listPlotWithCopy[data_List, joined : (True | False) : True] :=
   DynamicModule[{pt = {1, data[[1]]}},
      Column[{Framed@
         LocatorPane[Dynamic[pt],
            ListPlot[data, ImageSize -> Medium, Joined -> joined,
               Epilog -> {Red, PointSize[Large],
                  Dynamic@Point[With[{n = Round@pt[[1]]},
                     pt = {n, data[[n]]}]]}],
            Appearance -> None],
         Button["Copy Red Point to Clipboard", CopyToClipboard[pt],
            ImageSize -> {Full, Automatic}]},
         Right]]

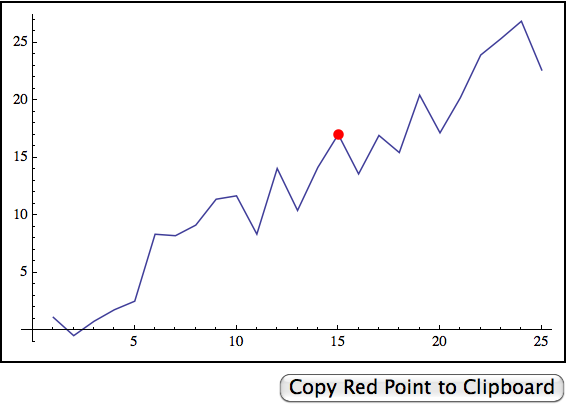
Here is how the output looks with the plot joined:

data = Range[25] + RandomReal[{-3, 3}, 25];
listPlotWithCopy[data]

Joined plot

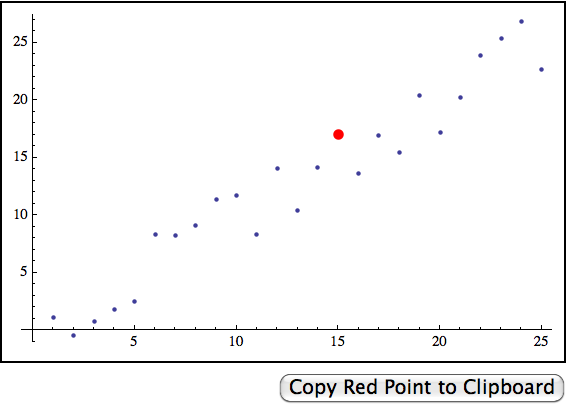
And here it is with joining turned off:

listPlotWithCopy[data, False]

Unjoined plot

$\endgroup$
1
$\begingroup$

It is not exactly what you had in mind, but has the same function. Try this:

    pickUpValue[lst_List, sz_Integer, join_] := 
 DynamicModule[{toClipboard, 
   pt = {IntegerPart[Length[lst]/2], 
     lst[[IntegerPart[Length[lst]/2]]]}},

  Column[{
            Show[{
             ListPlot[lst, ImageSize -> sz, Joined -> join],
                    Graphics[Locator[Dynamic[pt]]]          
                }],

      Button["Copy it", toClipboard = pt; CopyToClipboard[toClipboard]]

       }]]

In it variables the parameter join takes the values True and False. For example, assume this is the list:

lst = Range[25] + RandomReal[{-3, 3}, 25];

Let us evaluate it:

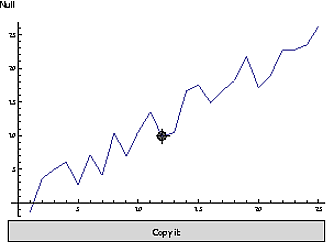
pickUpValue[lst, 400, True]

This enables one to pick up the value using the locator, and to copy it into the clipboard by pressing the button The screen shot

$\endgroup$
0

Your Answer

By clicking “Post Your Answer”, you agree to our terms of service and acknowledge you have read our privacy policy.

Not the answer you're looking for? Browse other questions tagged or ask your own question.