Given a point $\{x,y,z\}$ on the sphere, the function
dist[x_, y_, z_] = Abs[x + y];
is some positive number. If the range of dist over the sphere happens to be e.g. $[2,5]$, then the sphere should be red when dist[x, y, z] == 2 and green when dist[x, y, z] == 5.
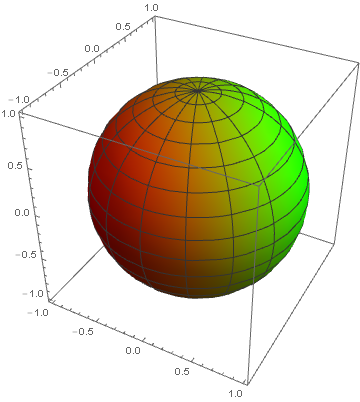
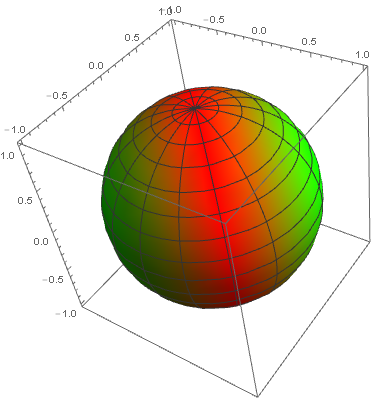
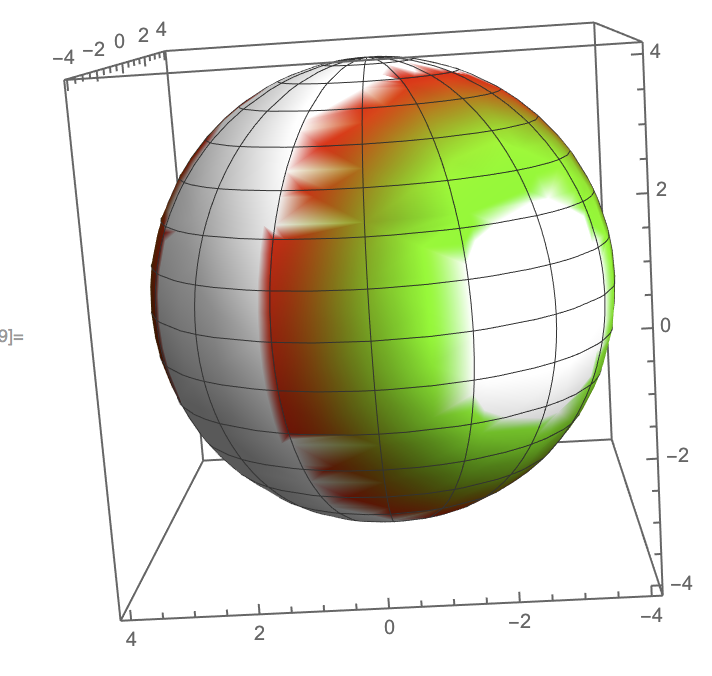
ParametricPlot3D[{Cos[u] Cos[v], Sin[u] Cos[v], Sin[v]}, {u, 0, 2 π}, {v, -π/2, π/2},
    ColorFunction -> (Blend[{Red, Green}, dist[#, #2, #3]] &)]
doesn't work because I don't know the range of dist in advance.
I can't find a suitable plot function to write
OtherPlotFunction[dist[x, y, z], {x, y, z} ∈ Sphere[],
                  ColorFunction -> (Blend[{Red, Green}, #] &)]
What plot function am I missing?

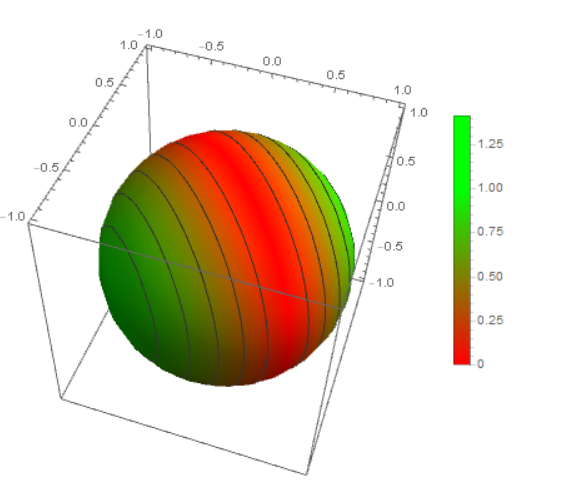
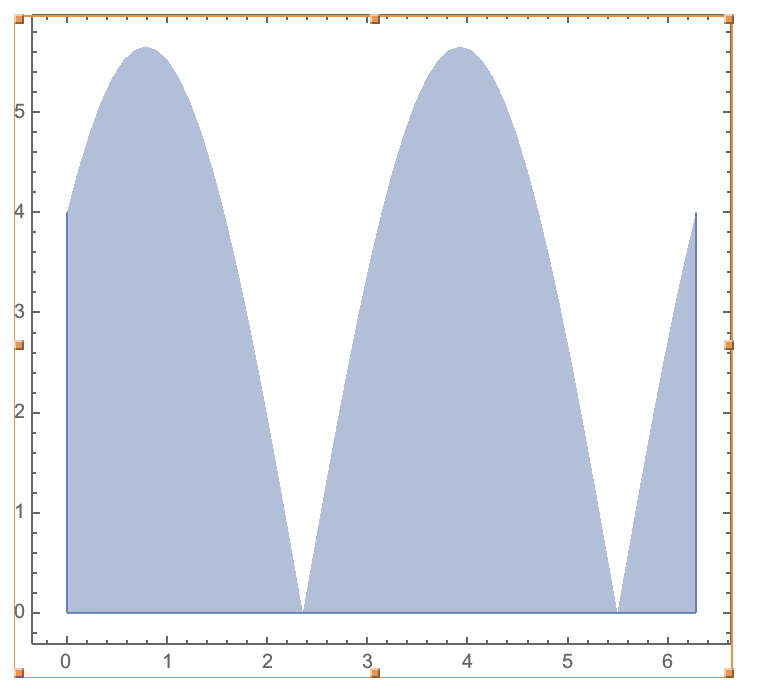
2<=Abs[x+y]<=5, how can this be posible? Maybe, I am missing something... $\endgroup$dist[x_, y_, z_] := Abs[x + y]instead ofdist[x_, y_, z_] = Abs[x + y]. Then you can just doSliceDensityPlot3D[dist[x, y, z], x^2 + y^2 + z^2 == 1, {x, -1, 1}, {y, -1, 1}, {z, -1, 1}, ColorFunction -> (Blend[{Red, Green}, #] &)]. $\endgroup$