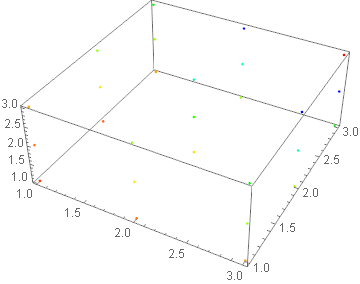
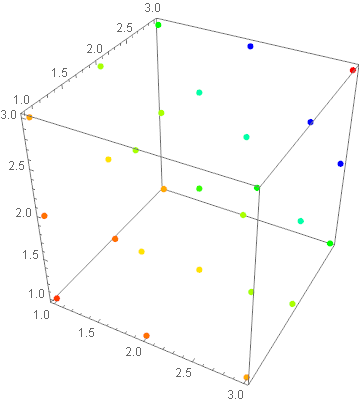
Goal: plot 3D lattice with knots of different color.
Input:
xyzF={{1, 1, 1, color111}, {1, 1, 2, color112},...,{N,N,N,colorNNN}}
Working example to color the grid into Hue[x]:
xyzF = Flatten[Table[{i, j, k, i*j*k/27.}, {i, 1, 3}, {j, 1, 3}, {k, 1, 3}], 2]
xyz = Map[#[[1 ;; 3]] &, xyzF]
ListPointPlot3D[xyz, ColorFunction -> Function[{x, y, z}, Hue[x]]]
NOT working example to color the grid into F[x,y,z]:
returnF[x_, y_, z_] := Module[{res},

Map[If[#[[1]] == x && #[[2]] == y && #[[3]] == z, res = #[[4]]] &, xyzF];
Return[Hue[res]]

];
ListPointPlot3D[xyz, ColorFunction -> Function[{x, y, z}, returnF[x,y,z]]]
Error message:
Ignoring invalid graphics directive Hue[$CellContext`$784].
What is the problem and how can I make it work?


