I have used the "RandomForest" method in Classify to classify my response variable (nominal with 2 levels). Can Classify, like R's RandomForest package, return variable importance? If yes, how do I access this information?
1 Answer
General remarks
I am not aware of built-in functions for retrieval of the variable importance from/with Classify and related functions.
I implemented (and documented) a package that provides such a function -- see VariableImportanceByClassifiers.m.
I have described the algorithm for determining the variable importance in this blog post: "Importance of variables investigation". Much more extensive explanations and examples are given in this document: "Importance of variables investigation guide".
This blog post "Classification and association rules for census income data" has examples and a discussion of determining variable importance using two classifiers, Decision Trees and Naive Bayesian Classifier, over census data.
The classifiers in the second blog post were developed before the introduction of Classify in Mathematica. Below is given code using Classify. The package VariableImportanceByClassifiers.m mentioned above is also based on Classify and related functions.
Procedure outline
Build a classifier with the training set.
Verify using the test set that good classification results are obtained.
If the number of variables (attributes) is $k$ for each $i$, $1\leq i \leq k$ :
Shuffle the values of the i-th column of the test data and find the classification success rates.
Compare the obtained $k$ classification success rates between each other and with the success rates obtained by the un-shuffled test data.
The variables for which the classification success rates are the worst are the most decisive.
Note that instead of using the overall baseline accuracy we can make the comparison over the accuracies for selected, more important class labels. (See the example below.)
Application
This code applies steps 1 and 3 of the procedure above over the "Titanic" dataset using classifiers obtained with different methods.
Import["https://raw.githubusercontent.com/antononcube/MathematicaForPrediction/master/VariableImportanceByClassifiers.m"]

testSetName = "Titanic";
trainingSet =
  ExampleData[{"MachineLearning", testSetName}, "TrainingData"];
 testSet = ExampleData[{"MachineLearning", testSetName}, "TestData"];
varNames =
  Flatten[List @@
    ExampleData[{"MachineLearning", testSetName},
     "VariableDescriptions"]];

mres = Association@Map[
    Function[{clMethod},
     cf = Classify[trainingSet, Method -> clMethod];
     accRes =
      AccuracyByVariableShuffling[cf, testSet, varNames,
       "FScoreLabels" -> "survived"];
     clMethod -> (accRes[None] - Rest[accRes])/accRes[None]
     ], {"LogisticRegression", "NearestNeighbors", "NeuralNetwork",
     "RandomForest", "SupportVectorMachine"}] ;

Dataset[mres]
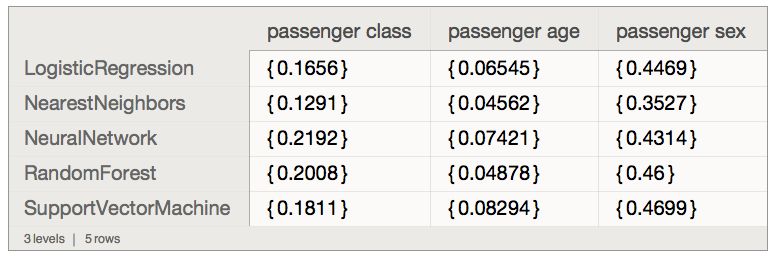
Note that the F-Scores of "survived" are used. The result dataset has Classify methods as rows and variable names as columns. The entries show the relative worsening of the classification when the corresponding variable is damaged in the test data.
We see that passenger sex is most decisive and that is confirmed with the corresponding mosaic plot below.
Implementation with Classify description
Below is given set-by-step code for applying the procedure described above.
First let us load some data. (Using the Titanic and Mushroom datasets).
testSetName = "Titanic"; (*"Mushroom"*)

trainingSet =
  ExampleData[{"MachineLearning", testSetName}, "TrainingData"];
Dimensions[trainingSet[[All, 1]]]

(* Out[192]= {916, 3} *)

testSet = ExampleData[{"MachineLearning", testSetName}, "TestData"];
Dimensions[testSet[[All, 1]]]

(* Out[194]= {393, 3} *)
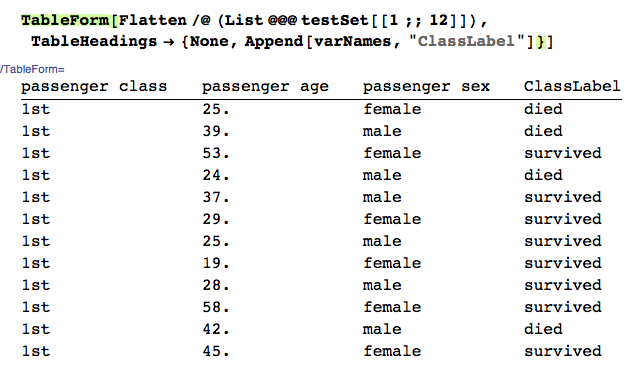
Here are samples of the training and testing datasets.
varNames =
 ExampleData[{"MachineLearning", testSetName}, "VariableDescriptions"][[1]]

(* Out[195]= {"passenger class", "passenger age", "passenger sex"} *)

TableForm[Flatten /@ (List @@@ trainingSet[[1 ;; 12]]),
 TableHeadings -> {None, Append[varNames, "ClassLabel"]}]
TableForm[Flatten /@ (List @@@ testSet[[1 ;; 12]]),
 TableHeadings -> {None, Append[varNames, "ClassLabel"]}]
Make the classifier.
mushCL = Classify[trainingSet, Method -> "RandomForest"]
Find the baseline accuracy. (FScores can be used instead; see the end of the post.)
baseAccuracy = ClassifierMeasurements[mushCL, testSet, "Accuracy"]

(* Out[199]= 0.78626 *)
Shuffle each column of the test set.
Block[{tmat = Transpose[testSet[[All, 1]]]},
  shuffledTestSets =
   Map[Function[{i},
     Thread[
      Transpose[ReplacePart[tmat, i -> RandomSample[tmat[[i]]]]] ->
       testSet[[All, 2]]]
     ], Range[Dimensions[tmat][[1]]]]
  ];
Calculate the classifier accuracy for each of the derived datasets (with shuffled columns).
accuraciesOfShuffledTestSets =
 ClassifierMeasurements[mushCL, #, "Accuracy"] & /@ shuffledTestSets

(* Out[201]= {0.697201, 0.783715, 0.625954} *)
Find the ratios with the base accuracy and make a table.
(*Titanic*)
TableForm[
 Transpose[{varNames, accuraciesOfShuffledTestSets,
   accuraciesOfShuffledTestSets/baseAccuracy}],
 TableHeadings -> {None, {"variable name", "shuffled accuracy",
    "ratio"}}]
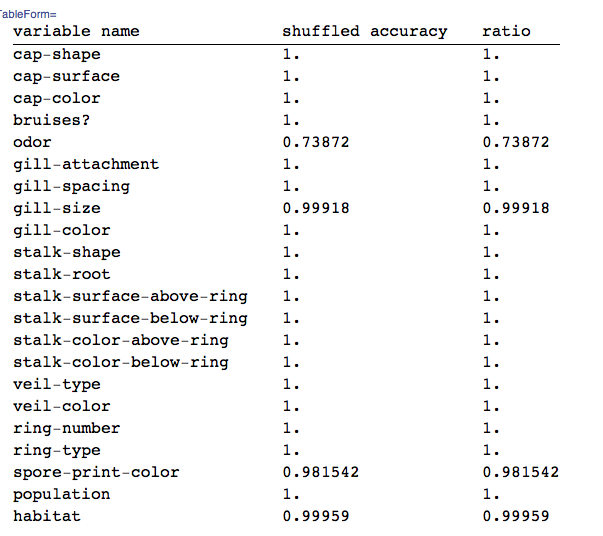
For the Titanic dataset the variable named "passenger sex" is found to be most decisive since the shuffling of its values produces the smallest accuracy.
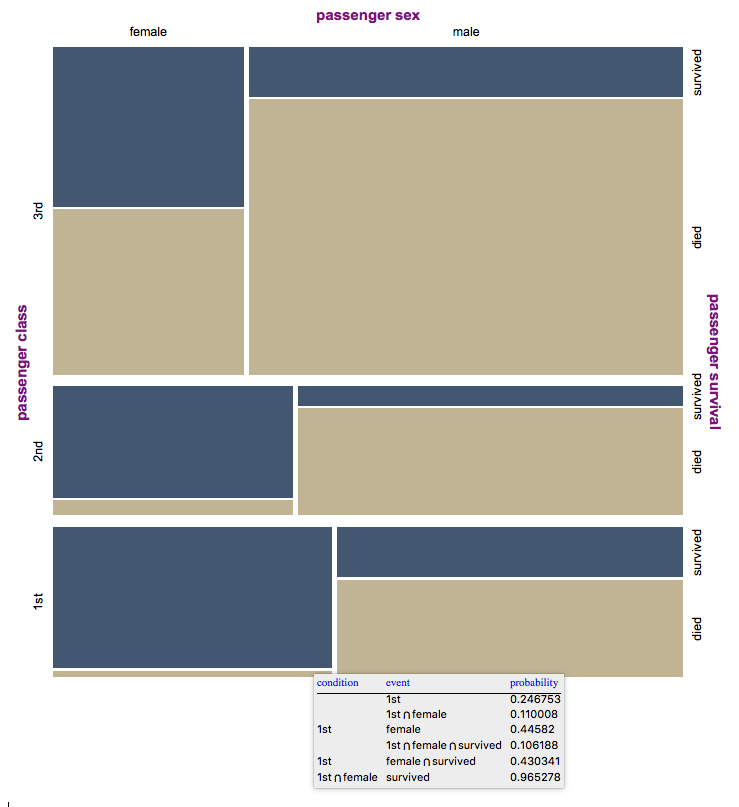
We can see that the sex of a passenger was more important than passenger's class. Further investigation shows that female and first class passengers were (much) more likely to survive.
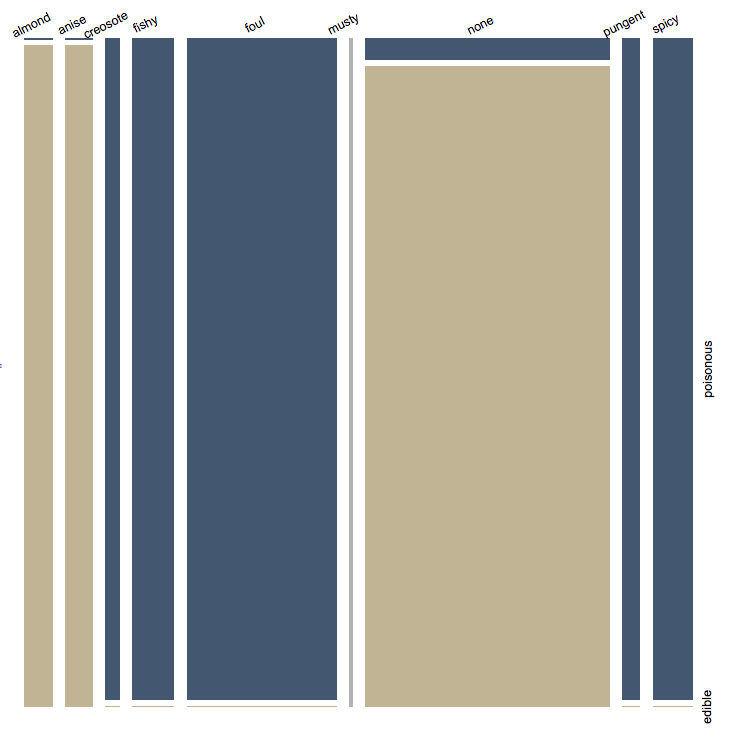
For the Mushroom dataset we see that the variable named "odor" is found to be most decisive since the shuffling of its values produces the smallest accuracy. (And that makes sense.)
Obviously, the procedure can applied for other datasets and with other classifiers.
As it was said above, instead of using the baseline accuracy we can make the comparison over the FScores of selected (considered important) class labels.
ClassifierMeasurements[mushCL, testSet, "FScore"]

(* Out[203]= <|"died" -> 0.842697, "survived" -> 0.666667|> *)
This functionality is provided in the package VariableImportanceByClassifiers.m.
Mosaic plots
As it was discussed in "Importance of variables investigation guide" we can use Mosaic plots for the confirmation of the found variable importance.
The following mosaic plot for "Titanic" shows that female passengers are much more likely to survive and especially female passengers from first and second class.
Similarly, looking at the mosaic plot for the "Mushroom" dataset over the variables "odor" and "edibility of mushroom" we can see why "odor" is so decisive. The odor values for "poisonous" and "edible" intersect very little.
(Dark blue corresponds to "poisonous", beige to "edible".)
-
$\begingroup$ Thank you, for taking the time to give me a comprehensive answer! Very helpful. $\endgroup$ Commented Dec 27, 2015 at 19:29
-
1$\begingroup$ @user34018 I am glad it is helpful. It was in my ToDo list to make a
Classifybased implementation of this procedure and your question stimulated that. $\endgroup$ Commented Dec 29, 2015 at 4:35 -
$\begingroup$ @AntonAntonov, somehow I tried to use your example but it didn't work. Have you done any update on the package, so it's working on a differente way in comparison to the answer you posted? Thanks in advance and congrats for the great job! I'm a really fan of your work! $\endgroup$– RodCommented Dec 9, 2016 at 21:17
-
1$\begingroup$ @Rod I think I fixed the problem -- I had a wrong argument given to Classify,
titanicTrainingDatainstead oftrainingSet. $\endgroup$ Commented Dec 10, 2016 at 18:09

