9
$\begingroup$

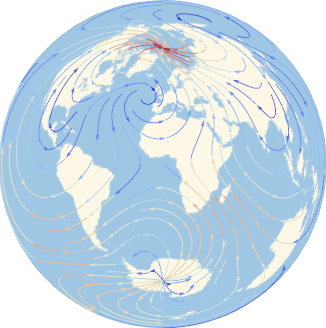
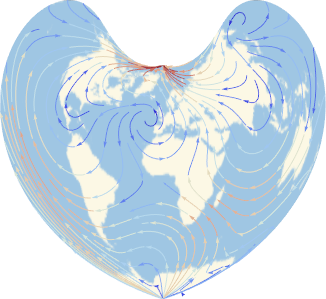
Suppose I want to VectorPlot on a geographic map a vector field defined on a Reference Ellipsoid.

The field is given to the following function as a f_ (or {fx_, fy_}) whose two components are the latitudinal and longitudinal components.

Following the approach I used to ContourPlot a scalar field I can end with a code like this:

SetAttributes[GeoGraphicsVectorPlot, HoldAll]
Options[GeoGraphicsVectorPlot] = {
   "GeoGraphicsOptions" -> {},
   "PlotCellsCount" -> 10000
   };
SyntaxInformation[
   GeoGraphicsContourPlot] = {"LocalVariables" -> {"Solve", {2, 2}}};

GeoGraphicsVectorPlot[f_, gcoords : {Repeated[_Symbol, {3}]}, 
  opts : OptionsPattern[]] :=
 Module[{geog, datum, proj, geogpol, mesh, coords, vlp, vlc, fl, fail,
    pvl, plotType, plotOptions, plot, plotPrimitives},

  geog = GeoGraphics[{}, OptionValue["GeoGraphicsOptions"]];
  {datum, proj} = {GeoModel, GeoProjection} /. 
    AbsoluteOptions[geog, {GeoModel, GeoProjection}];
  geogpol = 
   First@Cases[geog, 
     Polygon[vl_, ___, VertexTextureCoordinates -> _, ___] :> 
      Polygon@vl, \[Infinity]];
  mesh = DiscretizeRegion[geogpol, 
    MaxCellMeasure -> Area@geogpol/OptionValue["PlotCellsCount"]];
  coords = MeshCoordinates[mesh];
  vlp = GeoGridPosition[coords, proj, datum];
  vlc = GeoPositionXYZ[vlp];
  fl = With[{n = Length@gcoords}, 
    Map[Block[gcoords, gcoords = Take[#, n]; f] &, vlc[[1]]]];
  pvl = Transpose@{coords, fl};
  pvl = adjustVectorField[proj, datum] /@ pvl;
  plot = ListVectorPlot[pvl];
  MapAt[{{#}, plot[[1]]} &, Graphics @@ geog, {1}] 
  ]

adjustVectorField[proj_, datum_] := Identity

GeoGraphicsVectorPlot[{1, 2}, {x, y, z},
 "GeoGraphicsOptions" -> {GeoRange -> "World", GeoModel -> "GRS80", 
   GeoProjection -> "Mercator"}]

GeoGraphicsVectorPlot[{1, 2}, {x, y, z},
 "GeoGraphicsOptions" -> {GeoRange -> "World", GeoModel -> "GRS80", 
   GeoProjection -> "Equirectangular"}]

The tricky part, with respect to the scala field, is how to properly compute the projected direction of the field, i.e. how to define the family of functions adjustVectorField[proj_, datum_] so that it works on many (ideally all) map projections.

$\endgroup$
1
  • $\begingroup$ just leaving a link: 13411 $\endgroup$
    – Kuba
    Commented Jun 21, 2016 at 11:31

1 Answer 1

9
$\begingroup$

I'm not sure if I got the point, is this what you are after?

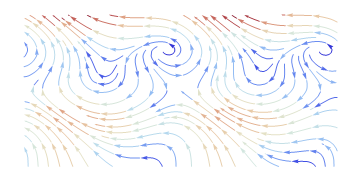
gr2 = StreamPlot[{-1 - Sin[x]^2 + Sin[3 y] + Cos[y]^2, 
   1 + Sin[2 x] - Cos[y]^2}, {x, -Pi, Pi}, {y, -Pi/2, Pi/2}, 
  AspectRatio -> 1/2, Frame -> False, 
  StreamColorFunction -> "ThermometerColors", StreamPoints -> 250]

enter image description here

GeoGraphics[
 First @ gr2 /. Arrow -> (Arrow @ GeoPath[Reverse[#, {2}] / Degree, "Rhumb"]&)
 ,
 GeoRange -> "World",
 GeoProjection -> "LambertAzimuthal"]

enter image description here

enter image description here

$\endgroup$
9
  • $\begingroup$ Something like this, yes. But I have two problems: 1) my field is defined in term of XYZ coords, not lat/long; 2) the stream lines are well distributed and well segmented in the preliminary graphic but in some projection (for example Mercator) become very distant and with segments very long near the poles. My tentative to work in the projected domain was to avoid this. $\endgroup$
    – unlikely
    Commented Jun 22, 2016 at 6:14
  • $\begingroup$ @unlikely I see, so you want the distribution uniform. What about arrows lengths, should the same magnitude near pole for Mercator be longer than near equator? $\endgroup$
    – Kuba
    Commented Jun 22, 2016 at 7:22
  • $\begingroup$ Not sure to understand your question... $\endgroup$
    – unlikely
    Commented Jun 22, 2016 at 7:27
  • $\begingroup$ @unlikely p.s. when I use GeoGraphicsVectorPlot[{x, y} // Normalize, {x, y, z}, it doesn't look right, unless I'm missing something, but VectorPlot[{x, y} // Normalize, {x, -Pi, Pi}, {y, -Pi/2, Pi/2} is ok. $\endgroup$
    – Kuba
    Commented Jun 22, 2016 at 7:27
  • $\begingroup$ @unlikely Arrows lengths are reflecting the magnitude of the field, when regions near poles are streched then those arrows will become longer which will reflect intensity but maybe you want {1,1} vector to be the same length on differently stretched regions, like in your example. $\endgroup$
    – Kuba
    Commented Jun 22, 2016 at 7:30

Your Answer

By clicking “Post Your Answer”, you agree to our terms of service and acknowledge you have read our privacy policy.

Not the answer you're looking for? Browse other questions tagged or ask your own question.