0
$\begingroup$

Hello everybody I try to solve this system of functions and try to plot it:

x == 0.5(1.+Tanh[0.5*(x*y^2-eps1)/t]
y == Tanh[(x^2*y+eps2)/t]

with eps1 = 0. and eps2 = 1, for instance. The problem is how I can not only solve it but plot for instance x vs. t and y vs. t . Is it possible to do it in Mathematica?

Can I use first Solve[...,....,{x,y}] and explicit, for example, x as functions of t and y and then plot it?

I have the plot of the sol_x vs. t attached here
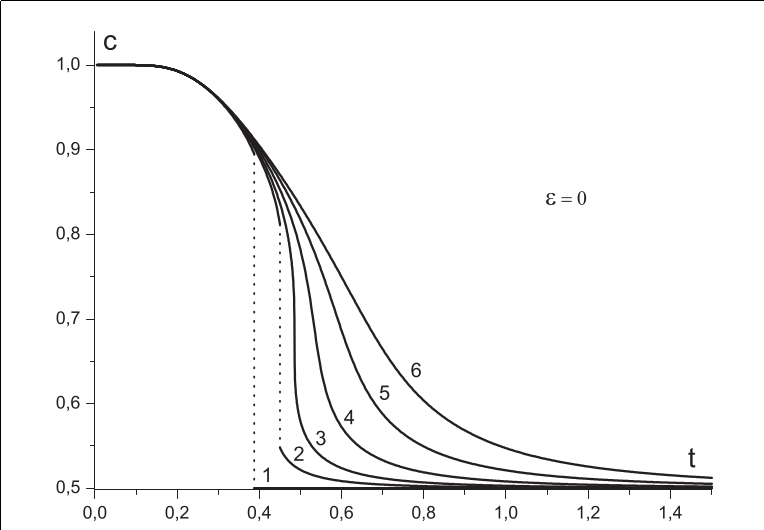
The numbers correspond to different values of eps2 that, in my example is equal to 1.

Discontinuities for particular parameters

As mention by MarcoB the code to solve this algebraic system of equation can be written as follow:

s1 = Table[{t, x} /. 
    FindRoot[{x == 1/2 (1 + Tanh[1/2 (x y^2 - eps)/t]), 
      y == Tanh[(x^2 y + h)/t]}, {x, 1.}, {y, 1.}], {t, .001, 1.5, 
    1/100}];

ListLinePlot[s1, PlotRange -> {Automatic, {0., 1.}}, 
 PlotRangePadding -> Scaled[.05], Frame -> True]

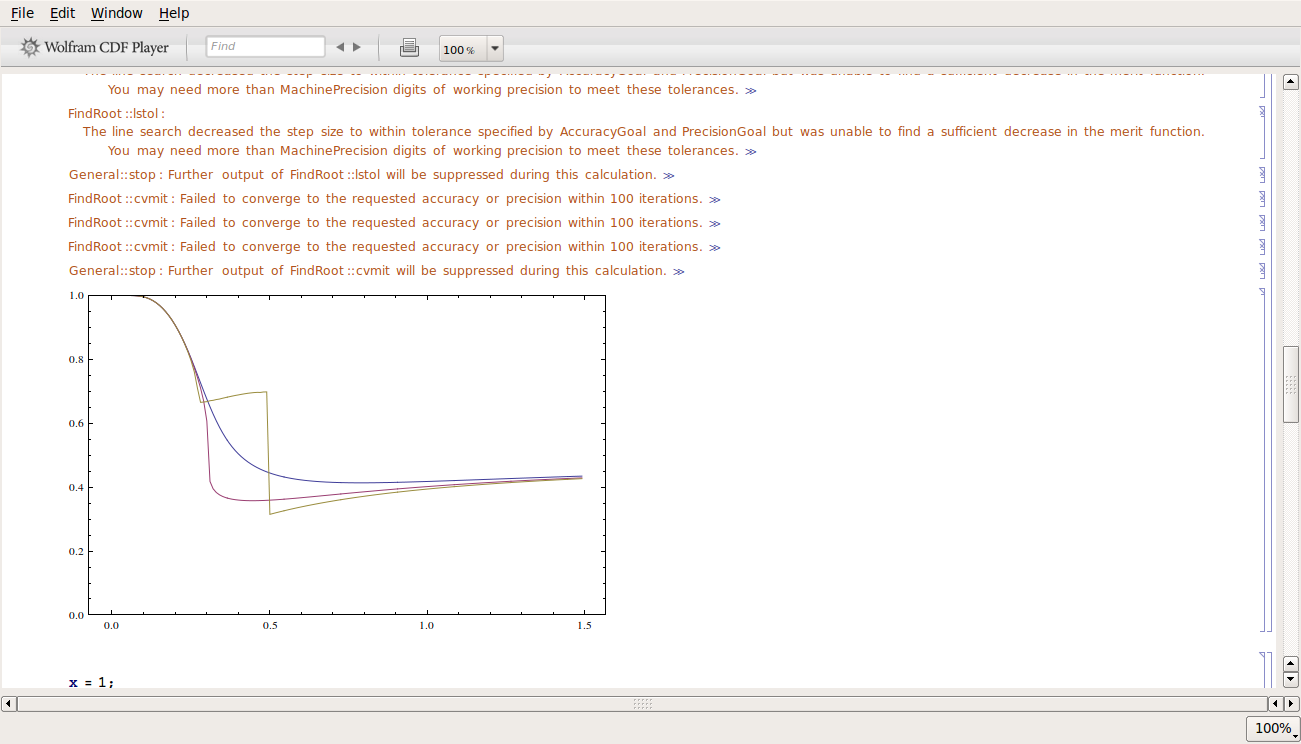
Where h, eps are two constant parameters. Now when I take particular parameters for h, eps (for instance: h = 0. and eps = 0. ) I have discontinuity while for other parameters I obtain smooth function. So this strange behaviour near the discontinuity is because FindRoot can't be able to converge? Or because there is some problem in accuracy? I try with AccuracyGoal and number of iterations but nothing change. Is it possible, somehow to fix this problem ?
Many thanks

$\endgroup$
3
  • $\begingroup$ It is about what language? What is **? $\endgroup$ Commented Apr 18, 2016 at 15:02
  • 1
    $\begingroup$ Start by expressing your equations in proper Mathematica syntax (e.g. tanh() is really TanH[], ** is probably ^ ), then look into ParametricPlot. $\endgroup$
    – MarcoB
    Commented Apr 18, 2016 at 15:03
  • $\begingroup$ Also note that equations use ==, not =. Finally, how is C in your plot above calculated from the equations you show? $\endgroup$
    – MarcoB
    Commented Apr 18, 2016 at 15:13

2 Answers 2

3
$\begingroup$

Solve seems unable to solve your system symbolically. One can solve it numerically for various values of $t$, $\epsilon_1$ and $\epsilon_2$.

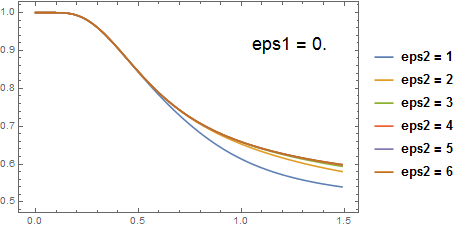
Setting eps1 = 0 as you indicated, we can use the following:

eps1 = 0;

Table[
  {t, x} /. FindRoot[
    {
     x == 1/2 (1 + Tanh[1/2 (x y^2 - eps1)/t]),
     y == Tanh[(x^2 y + eps2)/t]
    },
    {x, 1},
    {y, 1}
  ],
  {eps2, 1, 6, 1},
  {t, 1*^-9, 15/10, 1/100}
];

ListLinePlot[%,
 PlotRange -> {Automatic, {0.5, 1}},
 PlotRangePadding -> Scaled[.05], Frame -> True,
 Epilog -> Text[Style["eps1 = " <> ToString[N@eps1], 18], Scaled[{0.8, 0.8}]],
 PlotLegends -> (("eps2 = " <> ToString[#]) & /@ Range[6])
]

Mathematica graphics

However, this does not reproduce your graph very well, even for different values of eps1. You should provide a link to the source of the plot you showed and some context for your system of equations.

$\endgroup$
1
$\begingroup$

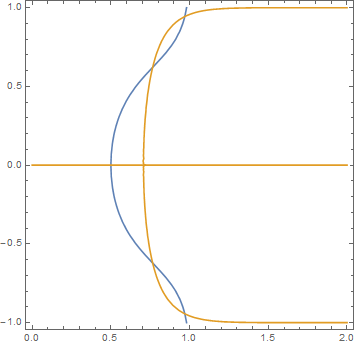
This may help, your problematic jump occurs because you have multiple solutions:

With[{t = 1/2, h = 0, eps = 0},
 ContourPlot[{
   x == 1/2 (1 + Tanh[(x y^2 + eps)/t]),
   y == Tanh[(x^2 y + h)/t]}, {x, 0, 2}, {y, -1, 1}]]

enter image description here

$\endgroup$

Your Answer

By clicking “Post Your Answer”, you agree to our terms of service and acknowledge you have read our privacy policy.

Not the answer you're looking for? Browse other questions tagged or ask your own question.