18
$\begingroup$

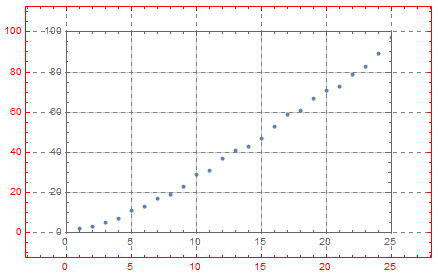
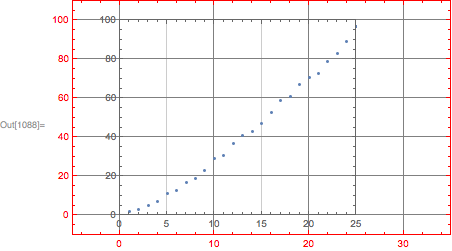
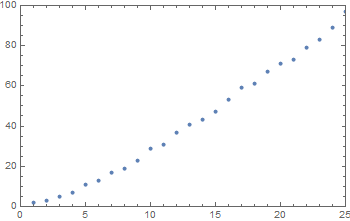
Suppose we have some plot with AspectRatio not being Automatic:

iIS = 350;
iPR = {{0, 25}, {0, 100}};
iIP = {{20, 5}, {15, 5}};
inset = ListPlot[Prime[Range[25]], ImageSize -> iIS, PlotRange -> iPR, 
  AxesStyle -> Bold, ImagePadding -> iIP, Frame -> True]

inset

Now we wish to place it as Inset inside of a larger Graphics object (with Frame->True) in such a way that the coordinate systems of both plots exactly coincide with each other and the original plot will not be cropped.

What is the right way to align coordinate systems of Inset and enclosing Graphics exactly?

The ideal solution would allow setting arbitrary PlotRange, ImageSize and ImagePadding for the enclosing Graphics.


(This quesiton is a more demanding variation of How to make Inset graphics maintain relative sizes when combined.)

$\endgroup$
6
  • 1
    $\begingroup$ Is this the same topic or are there any subtleties? mathematica.stackexchange.com/q/73522/5478 $\endgroup$
    – Kuba
    Commented May 17, 2015 at 6:42
  • $\begingroup$ @Kuba Yes, that thread is related but my question is substantially different: 1) the OP of that question was satisfied by approximate solution while I need exact match; 2) I consider more general case where AspectRation is not Automatic and both the inset and enclosing graphics have non-zero ImagePadding. $\endgroup$ Commented May 17, 2015 at 7:19
  • $\begingroup$ I put a link to that question in your own question that it may serve as a starting point or simpler case depending on circumstance of the reader. $\endgroup$
    – Mr.Wizard
    Commented May 17, 2015 at 10:01
  • 1
    $\begingroup$ I'm exploring a way to solve this for completely arbitrary graphics and I'm running into a problem that, for instance, resizing your inset does not resize the ImagePadding of the inset (valid and expected behavior, but somewhat complicates things). Does your question, nonetheless imply, that we know the padding of the inset anyway? Is it necessarily given as a fixed amount of printer points, or could it be in Scaled or ImageScaled coordinates? Could it be Automatic as well? $\endgroup$
    – LLlAMnYP
    Commented May 17, 2015 at 12:46
  • $\begingroup$ @LLlAMnYP Unfortunately ImagePadding accepts only explicit values in printer's points or All. Life would be much easier if this option would accept scaled specification. I assume that ImagePadding for the inset is specified in printer's points and is known. $\endgroup$ Commented May 17, 2015 at 13:13

3 Answers 3

12
$\begingroup$

As per the comment section of the OP I assume that the image padding is a constant number of printer points, though it is not necessarily known. I use the rasterize trick to obtain the size of the plotting range in printer points:

printerPointsPlotRange = 
    (#[[2]] - #[[1]] &)@
        (Rasterize[Show[#, Epilog ->
            {Annotation[Rectangle[Scaled[{0, 0}], Scaled[{1, 1}]],
                "Two", "Region"]}], "Regions"][[-1, 2]]) &

Similarly, my own implementation of ImageDimensions. It gives the size of the rectangle defined by Rectangle[ImageScaled[{0,0}],ImageScaled[{1,1}]] in printer points, which does not always match ImageDimensions if ImageSize and AspectRatio lead to conflicting results:

realImageDimensions = 
    (#[[2]] - #[[1]] &)@
        (Rasterize[Show[#, Epilog ->
            {Annotation[Rectangle[ImageScaled[{0, 0}], ImageScaled[{1, 1}]],
                "Two", "Region"]}], "Regions"][[-1, 2]]) &

I implement a modified version of PlotRange to account for PlotRangePadding.

realPlotRange =
    Module[
      {padding = Total /@ (Options[#, PlotRangePadding][[-1, 2]] /. None -> 0), 
       baserange = (#[[2]] - #[[1]] &) /@ PlotRange[#], range},

      range = (baserange + padding) /. 
        {a_ Scaled[b_] :> Scaled[a b], Scaled[a_] + Scaled[b_] :> Scaled[a + b]} /. 
          {a_ + Scaled[b_] :> a/(1 - b)};
      range] &

It appears to fail for mixed specifications, such as {{1,Scaled[.1]},{Scaled[.02],Scaled[.02]}}. However if the left and right paddings are both given either in Scaled form or in the coordinates of the plot and the same holds for the top and bottom padding specs, the function works fine.

plotRangeRatio = realPlotRange[#1]/realPlotRange[#2] &

Setting everything up:

SetOptions[Plot, {GridLines -> Automatic, Frame -> True}]
gr1 = Plot[Sin[x], {x, 0, 4}, PlotRange -> {{-1, 5}, {-2, 2}}, 
  PlotRangeClipping -> False, ImageSize -> {600, 400}, 
  ImagePadding -> 30]
gr2 = Plot[Cos[x], {x, -.5, 4}, ImageSize -> {400, 300}, 
  ImagePadding -> 30, PlotRange -> {{-.5, 4}, {-1, 1}}]

And producing the image:

Show[gr1, Epilog ->
    Inset[Show[gr2,
      ImageSize -> 
        plotRangeRatio[gr2, gr1] printerPointsPlotRange[gr1] +
        (realImageDimensions[gr2] - printerPointsPlotRange[gr2]), 
      AspectRatio ->
        (Last[#]/First[#] &)@
          (plotRangeRatio[gr2, gr1] printerPointsPlotRange[gr1])],
     {0, 0}, {0, 0}, Automatic]]
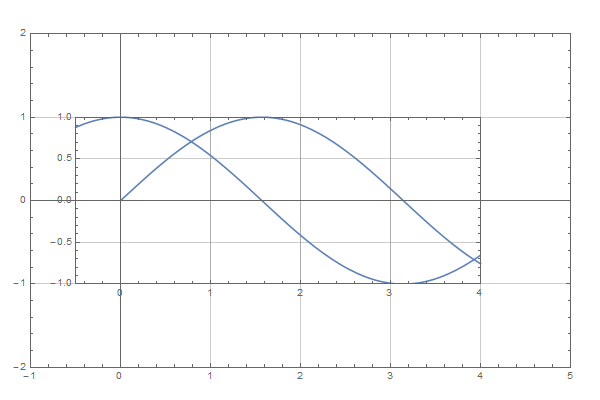
Plot in plot

The main assumption here is that the image padding is fixed and does not change upon resizing the image. It should then be always equal to

 (realImageDimensions[gr2] - printerPointsPlotRange[gr2])

where I do not even care, how wide the padding is on which side, all I care is how much bigger the image is, compared to the size of the plot range. So for plots with ImagePadding of 30, or {{5,55},{20,40}} or {{35,25},{50,10}} the above code will in all cases return {60,60}.

Upon aligning the coordinates the aspect ratio of the graphic being enclosed may change depending on the coordinate scales of the enclosing graphic. It is thus calculated beforehand and set to the appropriate value.

$\endgroup$
6
  • $\begingroup$ I appreciate this solution very much, it is great! Your realPlotRange currently fails in some cases, you may easily implement more universal analog on the base of my completePlotRange function instead. But I appreciate your straightforward approach in the realPlotRange implementation. $\endgroup$ Commented May 17, 2015 at 18:21
  • $\begingroup$ @AlexeyPopkov Please do elaborate, in which cases realPlotRange fails, I'd like to explore alternatives. $\endgroup$
    – LLlAMnYP
    Commented May 17, 2015 at 20:05
  • $\begingroup$ For example it fails for Graphics[{}, Frame -> True, PlotRange -> {{0, 1}, {0, 1}}, PlotRangePadding -> Scaled[.1]], it also fails for any graphics for which the function PlotRange fails, for example: Graphics[{GeometricTransformation[Rectangle[], RotationTransform[1]]}, Frame -> True]. $\endgroup$ Commented May 18, 2015 at 1:26
  • 1
    $\begingroup$ You can shorten the implementation of realPlotRange through an undocumented function: realPlotRange[gr_] := #2 - #1 & @@@ Charting`get2DPlotRange[gr] $\endgroup$ Commented Jun 28, 2016 at 12:01
  • $\begingroup$ @J.M. Charting`get2DPlotRange is more advanced currently (v. 10.4.1) than it was in version 8 but it is still Kernel-based and so will fail in many cases including the second example from my previous comment here. It also seemingly gives slightly wrong value for the first example from that comment. $\endgroup$ Commented Jun 28, 2016 at 20:09
11
$\begingroup$

My way of thinking so far:

  1. According to the Documentation, when the third argument of Inset is Automatic, the inset will have its original size inside of enclosing graphics. Its a good start.

  2. The inset has non-zero ImagePadding (needed for the frame ticks), so some additional space must be added inside of the plot range of the enclosing graphics via PlotRangePadding. Probably PlotRangePadding -> Scaled[.1] is a good value to start with.

  3. The enclosing graphics must have larger ImageSize. With PlotRangePadding -> Scaled[.1] the plot range covers a fraction 1-2*0.1 = 0.8 of the whole horizontal plotting range. So the image size must be iIS/0.8 (where iIS is ImageSize of the inset): ImageSize -> iIS/.8.

  4. When we increase overall image size we must scale ImagePadding proportionally in order to keep original scales for the axes. So we must set ImagePadding -> iIP/.8.

What we get with these settings:

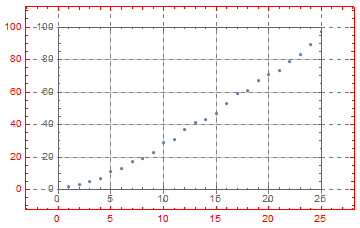
gr = Graphics[{Inset[
    Show[inset, GridLines -> Automatic], {0, 0}, {0, 0}, Automatic]}, 
  Frame -> True, PlotRange -> iPR, AspectRatio -> 1/GoldenRatio, 
  ImageSize -> iIS/.8, PlotRangePadding -> Scaled[.1], 
  FrameStyle -> Red, ImagePadding -> iIP/.8, GridLines -> Automatic, 
  GridLinesStyle -> Directive[Gray, Dashed]]

gr

This method works but requires a lot of manual tuning of options. I am still looking for a better alternative.


UPDATE 1: ImageScaled as fourth argument of Inset allows ImageSize to be arbitrary

Instead of adjusting ImageSize of enclosing graphics it is better to specify the size of the inset in scaled coordinates relative to the size of the enclosing graphics. Then the latter becomes arbitrary. As it is mentioned in p.3 above, the inset will have size 0.8 of the size of the enclosing graphics when PlotRangePadding -> Scaled[.1], so the third argument of Inset must be ImageScaled[.8]:

gr2 = Graphics[{Inset[
    Show[inset, GridLines -> Automatic], {0, 0}, {0, 0}, 
    ImageScaled[.8]]}, Frame -> True, PlotRange -> iPR, 
  AspectRatio -> 1/GoldenRatio, PlotRangePadding -> Scaled[.1], 
  FrameStyle -> Red, ImagePadding -> iIP/.8, GridLines -> Automatic, 
  GridLinesStyle -> Directive[Gray, Dashed]]

gr2

With this modification of the original approach we still must fix AspectRatio, PlotRange and ImagePadding of the enclosing graphics but now ImageSize is arbitrary! I'm still loooking for a way to make at least PlotRange of the enclosing graphics arbitrary too.


UPDATE 2: ImagePadding "features" and a way to arbitrary PlotRange

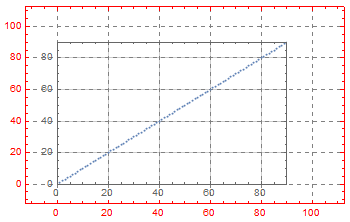
Further experimentation showed that ImagePadding of the Inset isn't scaled by the fourth argument of Inset but is applied unscaled. This can be proven as follows:

iIS = 350;
iPR = {{0, 100}, {0, 100}};
iIP = {{20, 5}, {15, 5}};
inset = ListPlot[Range[100], ImageSize -> iIS, 
   PlotRange -> {{0, 90}, {0, 90}}, AxesStyle -> Bold, 
   ImagePadding -> {{20, 5 + 25.5}, {15, 5}}, PlotRangePadding -> 0, 
   Frame -> True, AspectRatio -> 1/GoldenRatio];
gr3 = Graphics[{Inset[Show[inset, GridLines -> Automatic], {0, 0}, {0, 0}, 
    ImageScaled[.8]]}, Frame -> True, PlotRange -> iPR, 
  AspectRatio -> 1/GoldenRatio, PlotRangePadding -> Scaled[.1], 
  FrameStyle -> Red, ImagePadding -> iIP/.8, GridLines -> Automatic, 
  GridLinesStyle -> Directive[Gray, Dashed], ImageSize -> iIS]

output

In the above I have reduced the PlotRange of the inset by 10%. Correspondingly I must increase ImagePadding of the inset in order to keep the scale of the intrinsic coordinate system the same. The perfect match is achieved when I add 25.5 to the horizontal padding. This is calculated as follows:

0.1*(0.8*350 - 25)
25.5

where 0.8 is from ImageScaled[.8] (the fourth argument of Inset), 350 - horizontal ImageSize of the inset, 25 = 20 + 5 - horizontal ImagePadding, and 0.1 - 10% shortening of the horizontal PlotRange. In the above formula horizontal ImagePadding isn't multiplied by 0.8 (as one could expect) because scaling isn't applied to ImagePadding.

This feature is very unfortunate because it makes the plot not scalable again: for keeping the perfect match we must fix ImageSize of the enclosing graphics. But knowing this feature, we now can make PlotRange of the inset arbitrary!

One should also take into account that when the ImageSize -> w specification is used, the vertical ImagePadding seems to be ignored!

$\endgroup$
3
  • $\begingroup$ Alexey, if you don't mind my asking, what is the point you are trying to achieve? I can't think of a reason one would want to have an inset that takes most of the space in the surrounding plot, so I am having a hard time thinking of solutions. Could you tell us a bit more about what you would like to do with it? $\endgroup$
    – MarcoB
    Commented May 17, 2015 at 3:14
  • $\begingroup$ This approach can have interesting applications in infographics but original motivation was much more utilitarian: currently in Mathematica we have no direct way to control the distance between tick labels and frame and it came to mind that one possible way is to create an Inset only with frame and place it inside of another graphics which has only tick labels. But actually I already have used it in situations where I need to have two coordinate systems at the same time on the plot exactly aligned with each other. $\endgroup$ Commented May 17, 2015 at 3:29
  • $\begingroup$ Cool! Thank you, I was sure that I was missing something here, and I was quite curious to see where this was going. Thank you for commenting on this! $\endgroup$
    – MarcoB
    Commented May 17, 2015 at 3:31
5
$\begingroup$

Here is a solution that allows dynamic resizing of the image with a mouse.

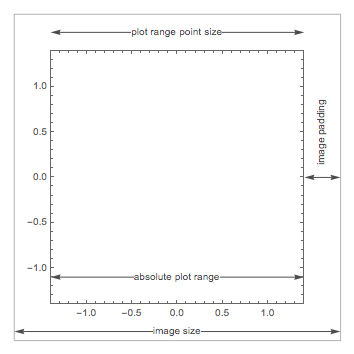
As shown by @LLlAMnYP, in order to get Inset graphics to line up with the coordinate system of the enclosing Graphics object, it is necessary to know both the absolute PlotRange and ImagePadding of the inset graphics, as well as the absolute PlotRange and ImagePadding of the enclosing Graphics. This is because the PlotRange and the ImagePadding of a graphic are independently controllable. Consider the following diagram:

enter image description here

To line up with the coordinate system of the enclosing Graphics object, the ratio of the plot range point sizes of the Inset object and the enclosing Graphics object must be the same as the ratio of their absolute plot ranges. The total inset size will then be the plot range point size plus the image padding. Consider the horizontal dimension. If we set:

  • ratio = ratio of absolute plot ranges of the inset and enclosing graphics
  • inset = total image padding (left + right) of the inset object
  • size = plot range point size of the enclosing graphics object

Then the horizontal size of the inset (in points) should be:

ratio * size + inset

or in Scaled coordinates:

Scaled[ratio + inset / size]

Notice that for nonzero inset, both of these expressions (and the equivalent ImageScaled version) depend on the size of the Image. This means that the size of the inset must change in a nontrivial way when the size of the enclosing graphics object is modified (e.g. by using the mouse). Therefore, to obtain a graphic where the inset graphics remain aligned to the enclosing graphic when the size is modified, one needs to use Dynamic.

All that remains is to determine the necessary graphics information for the Inset and enclosing Graphics objects. This can be done by using the graphicsInformation function from my answer to question 2091. Using this function, we can construct a dynamically updated graphics object where Inset objects are aligned correctly inside of an enclosing Graphics object even when the Graphics object is resized:

Options[overlayGraphics] = Options[Graphics];

overlayGraphics[prim_:{}, g:{__Graphics}, opts:OptionsPattern[]] := Module[
    {insetInfo, insetRanges, graphRange, graphInfo},

    insetInfo = graphicsInformation /@ g;

    insetRanges = "PlotRange" /. insetInfo;
    graphRange = Replace[OptionValue[PlotRange],
        Except[{{_?NumericQ,_?NumericQ},{_?NumericQ,_?NumericQ}}] :> combinedRange[insetRanges]
    ];
    graphInfo = graphicsInformation @ Graphics[prim, PlotRange -> graphRange, opts];
    graphRange = "PlotRange" /. graphInfo;

    With[
        {
        graphImagePadding = "ImagePadding" /. graphInfo,
        graphImagePaddingSize = "ImagePaddingSize" /. graphInfo,
        insetPadding = "ImagePadding" /. insetInfo,
        ratios = ScalingTransform[1/xyRange[graphRange]][xyRange/@insetRanges]
        },

        DynamicModule[{w,h},
            With[
                {
                insets = MapThread[
                    toInset[##, {w,h} - graphImagePaddingSize]&,
                    {g, insetPadding, insetRanges, ratios}
                ]
                },

                {w,h} = "ImageSize" /. graphInfo;
                Graphics[
                    {
                    prim,
                    insets
                    },

                    PlotRange -> graphRange, PlotRangePadding -> 0, 
                    AspectRatio -> Full, ImagePadding -> graphImagePadding,
                    ImageSize -> Dynamic[{w,h}], opts
                ]
            ]
        ]
    ]
]

combinedRange[p_] := MinMax /@ Transpose[p]

xyRange[{{a_,b_}, {c_,d_}}] := {b-a, d-c}

toInset[
    gr_Graphics,
    pad:{{l_, r_}, {b_, t_}},
    pr_,
    {xratio_, yratio_},
    {width_, height_}
] := Inset[
    Show[gr, PlotRange->pr, PlotRangePadding->0, AspectRatio->Full, ImagePadding->pad],
    {0,0},
    {0,0},
    Dynamic @ Scaled[{xratio + (r+l)/width, yratio + (b+t)/height}]
]

Some implementation details.

  1. I insert the explicit absolute plot range (with PlotRangePadding->0) and image padding into the inset and enclosing graphics so that any Automatic adjustments to PlotRange and ImagePadding are avoided.

  2. I use AspectRatio->Full for the Inset objects so that the 4th argument of the Inset controls the full size of the inset.

  3. I use AspectRatio->Full and explicit w and h ImageSize values for the enclosing Graphics object so that the resizing boxes directly control the ImageSize.

Here is overlayGraphics applied to your example inset:

overlayGraphics[
    {},
    {
    Show[inset, GridLines->Automatic]
    },
    Frame->True, FrameStyle->Red, PlotRange->{{-5, 35}, {-10, 110}},
    ImageSize->500, AspectRatio->1/GoldenRatio, GridLines->Automatic
]

enter image description here

Here is another example:

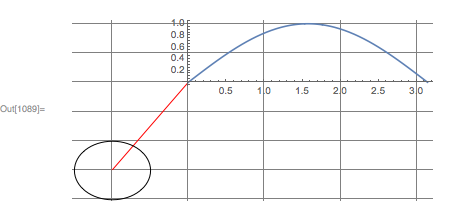
overlayGraphics[
    {Red, Line[{{-1,-1.5}, {0,0}}]},
    {
    Plot[Sin[x], {x, 0, Pi}],
    Graphics[{Circle[{-1, -1.5}, .5]}, ImagePadding->{{1, 2}, {3.3, 4.4}}]
    },
    AspectRatio -> .5, ImageSize -> 600, GridLines->Automatic, ImagePadding->20
]

enter image description here

$\endgroup$
1
  • $\begingroup$ Very slick! Happy to be the first to upvote this. :-) $\endgroup$
    – Mr.Wizard
    Commented Mar 2, 2017 at 2:53

Your Answer

By clicking “Post Your Answer”, you agree to our terms of service and acknowledge you have read our privacy policy.

Not the answer you're looking for? Browse other questions tagged or ask your own question.