8
$\begingroup$

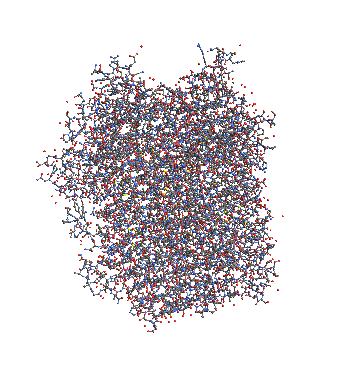
I am trying to determine the fractal dimension of this complex biomolecule (figure attached). Any clues as to how this can be done. In trying to determine this quantity, I wonder how its SecondaryStructure can be visualized. So there are 2 issues: 1) Visualizing its secondary structure, and 2) Determine its fractal dimension. Answer to One or both questions is appreciated.

Import["http://www.rcsb.org/pdb/download/downloadFile.do?fileFormat=pdb&compression=NO&structureId=2INU", "PDB", ImageSize -> Medium]

Import["http://www.rcsb.org/pdb/download/downloadFile.do?fileFormat=pdb&compression=NO&structureId=2INU", {"PDB", "SecondaryStructure"}]

Import["http://www.rcsb.org/pdb/download/downloadFile.do?fileFormat= pdb&compression=NO&structureId=2INU", {"PDB", "ResidueChainLabels"}]

enter image description here

$\endgroup$
7
  • 2
    $\begingroup$ How do you define fractal dimension (notice that for a physical system this is not a trivial question at all)? What is "secondary structure"? $\endgroup$
    – Igor Rivin
    Commented Sep 21, 2014 at 2:00
  • $\begingroup$ en.wikipedia.org/wiki/Nucleic_acid_secondary_structure gives a description of secondary structure which has to do with base pairs within the molecular system. This option is provided within MMA-10 $\endgroup$
    – thils
    Commented Sep 21, 2014 at 2:07
  • $\begingroup$ subutu-ap.eng.hokudai.ac.jp/nakayama/pdf/… provides a good source of quantifying the fractal dimension of this biomolecule, assuming that we consider that it is made up of networked nodes etc......I admit that this is not an easy problem, maybe an earlier query mathematica.stackexchange.com/questions/13125/… may be useful....so we map an image of the biomolecule & measure its fractal dimension via this method $\endgroup$
    – thils
    Commented Sep 21, 2014 at 2:13
  • 1
    $\begingroup$ When you have two distinct questions it is generally better to ask them separately. The site is easier for people to use that way (eg a future user looking for how to visualize secondary structure might overlook a question which appears to be about fractal dimensions). Also, you can only accept one answer, so what will you do if you get awesome but separate answers to both questions? $\endgroup$ Commented Sep 21, 2014 at 11:09
  • 1
    $\begingroup$ It might be best to leave it as it is now, since there is an answer which appears to address both questions. $\endgroup$ Commented Sep 23, 2014 at 20:45

1 Answer 1

12
$\begingroup$

Mathematica should render the secondary structure in the usual way when you import pdb files. I dont know why this doesn't work with the example you provided. I thought there might be a size limit for the protein but I managed to import much bigger proteins such as 1YHU and they got rendered without problems... strange.

Import["http://www.rcsb.org/pdb/download/downloadFile.do?fileFormat=\
    pdb&compression=NO&structureId=1YHU", "PDB"]
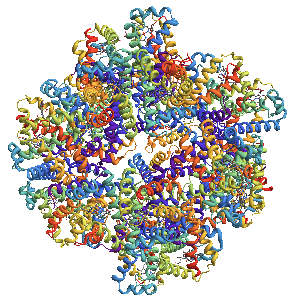
enter image description here

I don't know how fractal dimensions of biomolecules are usually calculated but simple box counting is always an option. The box counting dimension of an image can easily be determined by using ImagePartition as done in this post. The algorithm can easily be applied to 3D images.

This reduces the problem to the generation of a 3D image from the protein data. I though it was more convinient to use the mol2 format because Mathematica should allow the import of EdgeRules for this format. Anyways, I couldn't get that to work and I ended up extracting the VertexCoordinates and EdgeRules by pattern matching.

data = Import["../2DSP1.mol2", "Lines"];

StringSplit[#] & /@ 
   StringCases[data, DigitCharacter .. ~~ ___ ~~ "1.000"] //. {} -> 
   Sequence[];
coord = ToExpression@Flatten[%, 1][[All, 3 ;; 5]];
StringSplit[#] & /@ 
   StringCases[data, 
    DigitCharacter .. ~~ Whitespace ~~ DigitCharacter .. ~~ 
     Whitespace ~~ DigitCharacter .. ~~ Whitespace ~~ 
     DigitCharacter ..] //. {} -> Sequence[];
edgeRules = ToExpression@Rest@Flatten[%, 1][[All, 2 ;; 3]];

Graphics3D[Line[{coord[[#1]], coord[[#2]]}] & @@@ edgeRules]
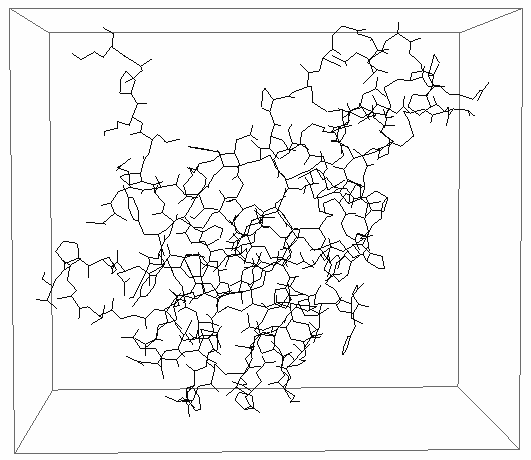
enter image description here

The conversion to Image3D was done by populating a SparseArray with points along the connection network. This can definitely be improved but you get the idea. The current implementation takes a lot of memory!

ranges = {Floor@Min[#], Ceiling@Max[#]} & /@ Transpose[coord];
scaling = 8;
Image3DDim = scaling (#2 - #1) & @@@ ranges;
lin = LinearSolve[{{ranges[[#, 1]], 1}, {ranges[[#, 2]], 1}}, {1, 
      Image3DDim[[#]]}] & /@ Range[3];

raster = 20;
rasterPoints = 
  Flatten[Table[
      coord[[#1]] - (coord[[#1]] - coord[[#2]])/raster*a, {a, 0, 
       raster}] & @@@ edgeRules, 1];
res = DeleteDuplicates@
   Transpose@
    Flatten[{Round[
         lin[[#, 1]] rasterPoints[[All, #]] + lin[[#, 2]]] & /@ 
       Range[3]}, 1];

i = Image3D[SparseArray[# -> 1 & /@ res],"Bit", 
  ColorFunction -> "WhiteBlackOpacity", Boxed -> True]
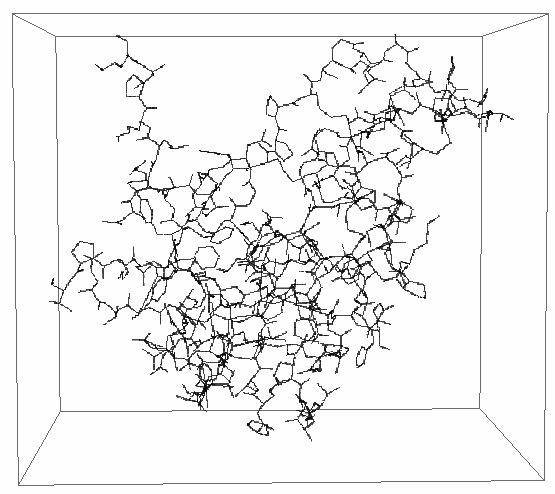
enter image description here

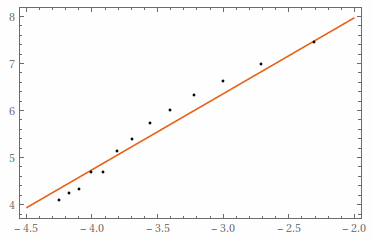
The box counting code gives as a fractal dimension of ~1.6.

MinS = Floor[Min[ImageDimensions[i]]/2];
data = ParallelTable[{1/size, 
    Total[Sign /@ (Total[#, 3] & /@ (ImageData /@ 
          Flatten[ImagePartition[i, size]]))]}, {size, 5, MinS/2, 5}];

line = Fit[Log[data], {1, x}, x]
Plot[line, {x, -4.5, -2}, Epilog -> Point[Log[data]], Frame -> True, 
 Axes -> False, PlotTheme -> "Scientific"]

11.2048 + 1.61623 x
enter image description here

$\endgroup$
2
  • 1
    $\begingroup$ Nice post :) +1 $\endgroup$
    – Sektor
    Commented Sep 23, 2014 at 21:16
  • $\begingroup$ i have a set of points in 3-dimensions and i want to extend this code can you help me ? $\endgroup$ Commented May 15, 2019 at 19:52

Your Answer

By clicking “Post Your Answer”, you agree to our terms of service and acknowledge you have read our privacy policy.

Not the answer you're looking for? Browse other questions tagged or ask your own question.