14
$\begingroup$

I'm trying to create some "publication quality" figures, but Mathematica is fighting me all the way. So my question is: Should I switch to Origin? Please help!


Well, all joking aside: I'm trying to create a multipanel figure. Here is an example:

p1 = Plot[100 Sin@x, {x, -5, 5}, Frame -> True, 
   FrameLabel -> {"XXX", "YYY"}, LabelStyle -> Large, 
   ImageSize -> 400, ImagePadding -> {{100, 1}, {0, 10}}];
p2 = Plot[5 Sin@x, {x, -5, 5}, Frame -> True, 
   FrameLabel -> {"XXX", "TTTT"}, LabelStyle -> Large, 
   ImageSize -> 400, ImagePadding -> {{100, 1}, {40, 0}}];
Column[{p1, p2}, Spacings -> 0]
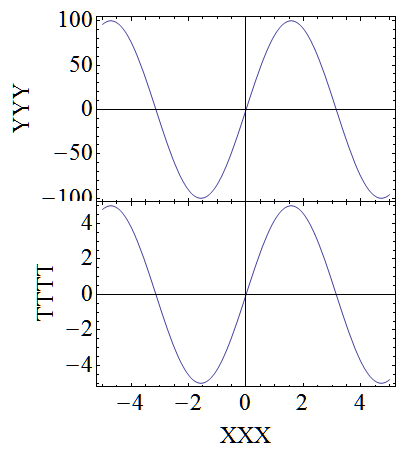
Example image

So the real question is: How can I align the TTTT and YYYY axes labels?

I also tried using grid, with separate labels but then the TTTT is not centered on the axis, but is too low.

$\endgroup$
8
  • 1
    $\begingroup$ Maybe this is related. $\endgroup$
    – Rod
    Commented Jun 13, 2013 at 8:40
  • 1
    $\begingroup$ Possibly related: link $\endgroup$ Commented Jun 13, 2013 at 8:45
  • 1
    $\begingroup$ @RodLm It is indeed (only searched google and this site). Inset may be the way to go. $\endgroup$
    – Ajasja
    Commented Jun 13, 2013 at 8:47
  • $\begingroup$ For this answer, you used LevelScheme` . This is the type of thing it was built for. $\endgroup$
    – rcollyer
    Commented Jun 13, 2013 at 12:14
  • $\begingroup$ @rcollyer Indeed! but I can't get rid of the blurry outline (assuming I would like to keep the error bars semi transparent). $\endgroup$
    – Ajasja
    Commented Jun 13, 2013 at 12:20

4 Answers 4

7
$\begingroup$

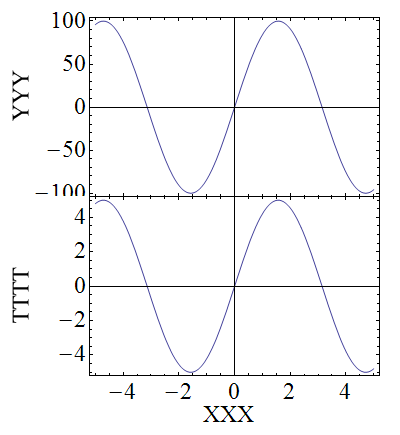
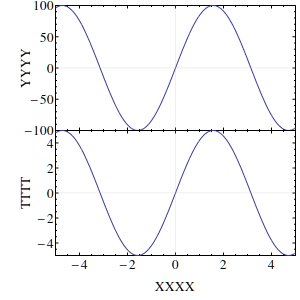
Mark Caprio's LevelScheme is great for this stuff. Overkill actually ....

Quiet@Needs["LevelScheme`LevelScheme`"]

(* plot the functions *)
p1 = Plot[100 Sin@x, {x, -5, 5}, Frame -> True, LabelStyle -> Large, 
   ImageSize -> 400, ImagePadding -> {{60, 50}, {0, Automatic}}];
p2 = Plot[5 Sin@x, {x, -5, 5}, Frame -> True, LabelStyle -> Large, 
   ImageSize -> 400, ImagePadding -> {{60, 50}, {Automatic, 0}}];

(* define grids *)
grd1 = Graphics[{Directive[Lighter@Gray, Thin],
    Line[{{-5, 0}, {5, 0}}],
    Line[{{0, -100}, {0, 100}}]
    }];
grd2 = Graphics[{Directive[Lighter@Gray, Thin],
    Line[{{-5, 0}, {5, 0}}],
    Line[{{0, -100}, {0, 100}}]
    }];

(* assemble figure *)
Figure[{
  Multipanel[{2, 1},
   XPanelSizes -> 1,
   YPanelSizes -> {.5, .5},
   XPlotRanges -> {-5, 5},
   YPlotRanges -> {{-100, 100}, {-5, 5}},
   XFrameLabels -> "XXXX",
   YFrameLabels -> {"YYYY", "TTTT"},
   Margin -> {{55, 5}, {45, 5 }},
   BufferB -> 5,
   BufferL -> 5
   ],
  FigurePanel[{1, 1}, ShowPanelLetter -> False],
  RawGraphics@p1,
  RawGraphics@grd1,
  FigurePanel[{2, 1}, ShowPanelLetter -> False],
  RawGraphics@p2,
  RawGraphics@grd2
  },
 ImageSize -> {300, 300}
 ]

Level scheme graphics

$\endgroup$
11
  • 1
    $\begingroup$ +1 I agree completely. I thought RawGraphics did'nt work work with ListErrorPlot, but it seems it works "well enough" i.sstatic.net/eizr8.png (the plot markers for some reason al drawn all over the place) $\endgroup$
    – Ajasja
    Commented Jun 14, 2013 at 8:52
  • $\begingroup$ Also, why Quiet@Needs["LevelScheme`LevelScheme`"] instead of just Needs["LevelScheme`"]? $\endgroup$
    – Ajasja
    Commented Jun 14, 2013 at 8:57
  • $\begingroup$ @Ajasja: I'm using an older version which loads (in 9.0) with warning messages. Regarding your first comment, I would suggest examining your plot ranges. $\endgroup$
    – dwa
    Commented Jun 14, 2013 at 9:33
  • $\begingroup$ @dws yes, I realize I could change the plot range. I just find it interesting that lines are clipped, but not plot markers. $\endgroup$
    – Ajasja
    Commented Jun 14, 2013 at 9:37
  • $\begingroup$ Sorry to bump this with a not so related question, but when I run your code (@dwa) I get the errors Scheme::prange: No value specified for option PlotRange. Assuming default value {{0,1},{0,1}}. and Multipanel::lsargs: Missing or unexpected arguments in level scheme object Multipanel[{2,1},XPanelSizes->1,YPanelSizes->{0.5,0.5},.... What is wrong? $\endgroup$
    – Sos
    Commented Jan 27, 2014 at 19:24
4
$\begingroup$

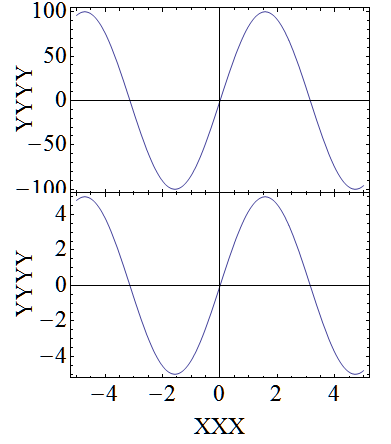
I would like to do it with Grid:

p1 = Plot[100 Sin@x, {x, -5, 5},
          Frame -> True,
          LabelStyle -> Large,
          ImageSize -> 400, ImagePadding -> {{60, 50}, {0, Automatic}}];
p2 = Plot[5 Sin@x, {x, -5, 5},
          Frame -> True,
          LabelStyle -> Large,
          ImageSize -> 400, ImagePadding -> {{60, 50}, {Automatic, 0}}];
Grid[{{
       Rotate[Style["YYY", "Graphics", Large, RGBColor[0, 0, 0, .999]], π/2],
       Rotate[Style["TTTT", "Graphics", Large, RGBColor[0, 0, 0, .999]], π/2],
       ""},
      {p1, p2, Style["XXX", "Graphics", Large]}
     }\[Transpose],
     Spacings -> {0, 0}, ItemSize -> Full]

grid alignment

$\endgroup$
6
  • $\begingroup$ Yup, I tried that. But then TTTT is off center. Although in my case I did not label the X axes with a grid, so it was even more noticeable. A fake example here i.sstatic.net/gCEkH.png $\endgroup$
    – Ajasja
    Commented Jun 13, 2013 at 8:51
  • $\begingroup$ @Ajasja I remember there is a question about this off-center issue. But I can't remember any keyword for now.. :( $\endgroup$
    – Silvia
    Commented Jun 13, 2013 at 8:53
  • $\begingroup$ @Ajasja OK my memory lapses.. It's about FrameLabel not printing completely.. But I think you can align your labels more easily with Alignment option of Grid. $\endgroup$
    – Silvia
    Commented Jun 13, 2013 at 9:03
  • $\begingroup$ @Ajasja Also you can use Spacer[...] to support any boxes. $\endgroup$
    – Silvia
    Commented Jun 13, 2013 at 9:10
  • $\begingroup$ Thanks, didn't know about spacer. $\endgroup$
    – Ajasja
    Commented Jun 13, 2013 at 9:19
4
$\begingroup$

In the end I used Epilog with Text. The downside of this approach is that the plot label style is not automatically picked up. I really have to learn to better use LevelScheme some day... (or matplotlib:)

p1=Plot[100 Sin@x,{x,-5,5},Frame->True,FrameLabel->{"XXX",""},LabelStyle->Large
    ,ImageSize->400,ImagePadding->{{100,1},{0,10}},PlotRangeClipping->False
    ,Epilog->{Text[Rotate[Style[#,Large],\[Pi]/2]&@"YYYY",Scaled[{-0.15,0.5}]]}];

p2=Plot[5 Sin@x,{x,-5,5},Frame->True,FrameLabel->{"XXX",""},LabelStyle->Large
    ,ImageSize->400,ImagePadding->{{100,1},{Automatic,0}},PlotRangeClipping->False
    ,Epilog->{Text[Rotate[Style[#,Large],\[Pi]/2]&@"YYYY",Scaled[{-0.15,0.5}]]}];

Column[{p1,p2},Spacings->0]

Example image

$\endgroup$
1
$\begingroup$

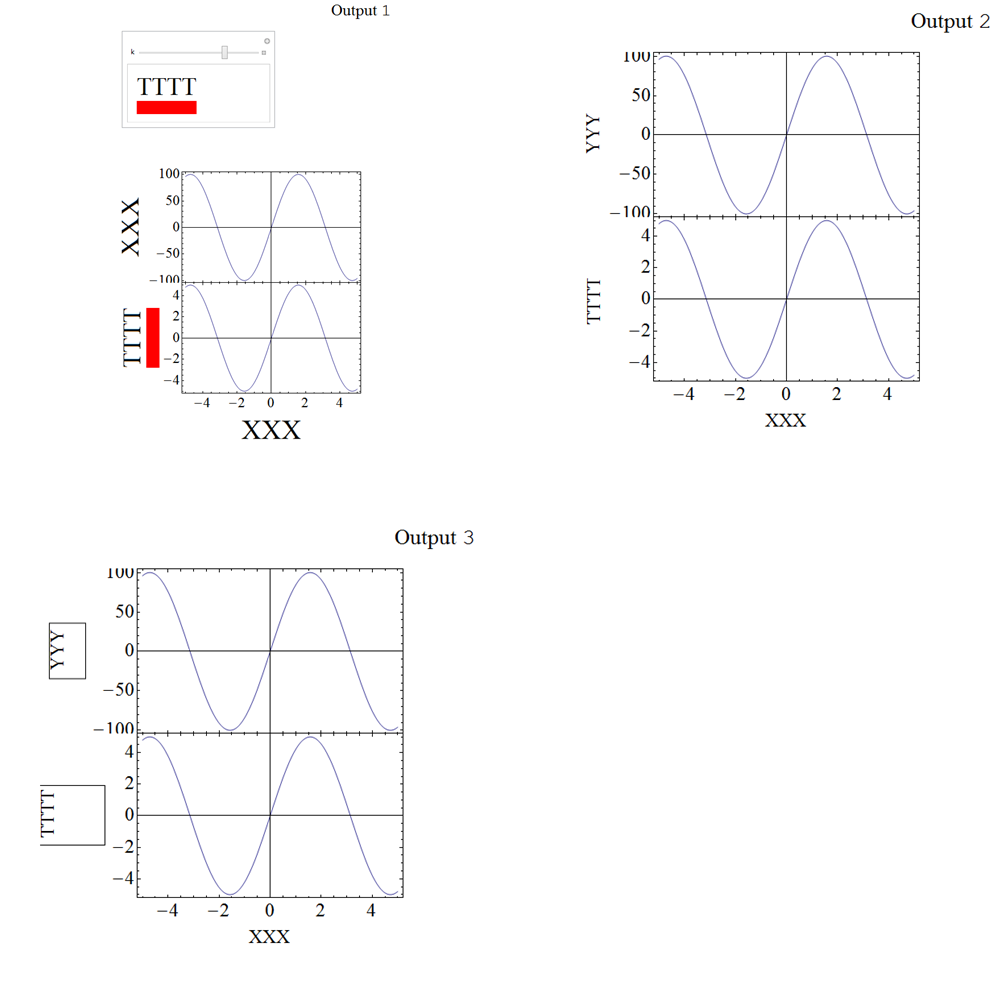
Method 1 Rasterize FrameLabel


Control the size with ImagePad, and need Raterize for ImagePad.

======================================================================Input 1

  1.  rasterizePad[x_, pad_: {{0, 0}, {0, 0}}] := 
    
      Rasterize[
    
       ImagePad[Rasterize[Style[ToString@x, FontFamily -> Times], 
    
         ImageSize -> 100], t = pad, Red]]
    
     frameLables11 = rasterizePad[XXX]; frameLables12 = 
    
      rasterizePad[YYY]; frameLables21 = rasterizePad[XXX];
    
     Manipulate[
    
      frameLables22 = rasterizePad[TTTT, {{0, 0}, {k, 0}}], {k, 0, 30, 1}]
    
     p11 = Plot[100 Sin@x, {x, -5, 5}, Frame -> True, 
    
        FrameLabel -> {frameLables11, frameLables11}, LabelStyle -> Large, 
    
        ImageSize -> 400, ImagePadding -> {{100, 1}, {0, 40}}];
    
     p12 = Plot[5 Sin@x, {x, -5, 5}, Frame -> True, 
    
        FrameLabel -> {frameLables21, Dynamic@frameLables22}, 
    
        LabelStyle -> Large, ImageSize -> 400, 
    
        ImagePadding -> {{100, 1}, {100, 0}}];
    
     Dynamic@Column[{p11, p12}, Spacings -> 0]
    

Method 2 use Graphics FrameLabel


======================================================================Input 2

  1.  frameGraphics = 
    
       Graphics[{Text[Style["TTTT", FontSize -> 24], {0, 1}], {Opacity[0], 
    
          Rectangle[{0, 0}, {1, 1}]}}, ImageSize -> {100, 50}];
    
     p21 = Plot[100 Sin@x, {x, -5, 5}, Frame -> True, 
    
        FrameLabel -> {"XXX", "YYY"}, LabelStyle -> Large, 
    
        ImageSize -> 500, ImagePadding -> {{120, 50}, {0, 0}}];
    
     p22 = Plot[5 Sin@x, {x, -5, 5}, Frame -> True, 
    
        FrameLabel -> {"XXX", frameGraphics}, LabelStyle -> Large, 
    
        ImageSize -> 500, ImagePadding -> {{120, 50}, {60, 0}}];
    
     Column[{p21, p22}, Spacings -> 0]
    

Method 3(failed)


As @silvia mentioned in her comment of her answer about Spacers.

So I tried this:

I think I failed here in using Sapcings,Column and Spacers

======================================================================Input 3

  1.  p31 = Plot[100 Sin@x, {x, -5, 5}, Frame -> True, 
    
        FrameLabel -> {"XXX", 
    
          Column[{"YYY", ""}, Spacings -> 0, Frame -> True]}, 
    
        LabelStyle -> Large, ImageSize -> 500, 
    
        ImagePadding -> {{120, 50}, {0, 0}}];
    
     p32 = Plot[5 Sin@x, {x, -5, 5}, Frame -> True, 
    
        FrameLabel -> {"XXX", 
    
          Column[{"TTTT", Spacer[{0, 1}]}, Spacings -> 1, Frame -> True]}, 
    
        LabelStyle -> Large, ImageSize -> 500, 
    
        ImagePadding -> {{120, 50}, {60, 0}}];
    
     Column[{p31, p32}, Spacings -> 0]
    

Any Suggestions?

enter image description here

$\endgroup$

Your Answer

By clicking “Post Your Answer”, you agree to our terms of service and acknowledge you have read our privacy policy.

Not the answer you're looking for? Browse other questions tagged or ask your own question.