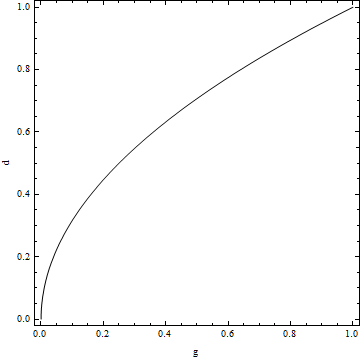
Suppose I wanted to draw the zero contour for the function $$d^2-g.$$ I could use the following code:
ContourPlot[d^2-g,{g,0,1},{d,0,1},Contours->{0},
              ContourStyle->Black,ContourShading->None,FrameLabel->{"g","d"}]
Which produces this:

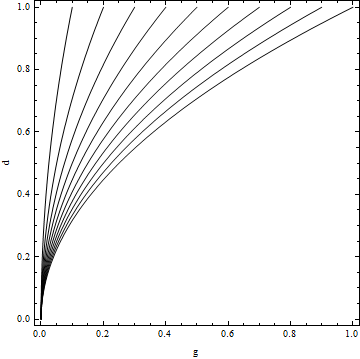
Taking this one step further, I might want to plot the zero contour for $$td^2-g.$$ at various values of $t$, which I could achieve functionally with
Show[Table[ContourPlot[t*d^2-g,{g,0,1},{d,0,1},Contours->{0},
         ContourStyle->Black,ContourShading->None,FrameLabel->{"g","d"}],{t,0.1,1,0.1}]]
producing this:

Now, to make this easier to understand, I want to label each contour with its corresponding value of $t$, but this is where I run into trouble. I had thought that this could be achieved with the option
ContourLabels->t
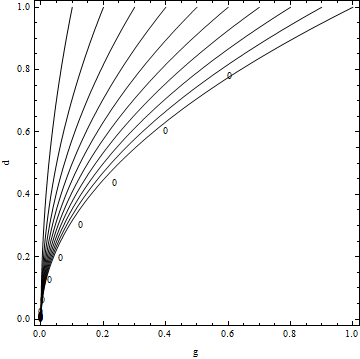
but that yields this:

(it seems to have moved the labels rather than changing them). Does anyone know how to get Mathematica to draw a label equal to the relevant value of t on each of these contours?
Secondly, assuming I can get that working, how can I reposition the labels towards the top of the contours so that they appear where the contours are furthest apart.
