replaced http://mathematica.stackexchange.com/ with https://mathematica.stackexchange.com/
Source Link

This is perhaps too "creative". Some health checks needed for the series behavior:

Graphics`Region`RegionInit[];
region = (x x + 4 y y + 9 z z <= 1);
paregion = Region`ParametricRegion[{{x, y, z}, region}];
k = FullSimplify@
     Normal@Series[Sqrt[(1-9 z^2) (1-9 z^2-4 y^2)], {z,0, #},{y,0, #}] &/@ Range[1, 10, 2];
res = N@Integrate[#, {x, y, z} ∈ paregion] & /@ k

(* {0.698132, 0.488692, 0.480154, 0.477423, 0.476201} *)

So the result is near to 0.476

ListLinePlot@res
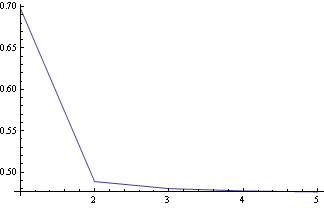
Mathematica graphics

ThisThis is where I've read first about this way for using Integrate[]

This is perhaps too "creative". Some health checks needed for the series behavior:

Graphics`Region`RegionInit[];
region = (x x + 4 y y + 9 z z <= 1);
paregion = Region`ParametricRegion[{{x, y, z}, region}];
k = FullSimplify@
     Normal@Series[Sqrt[(1-9 z^2) (1-9 z^2-4 y^2)], {z,0, #},{y,0, #}] &/@ Range[1, 10, 2];
res = N@Integrate[#, {x, y, z} ∈ paregion] & /@ k

(* {0.698132, 0.488692, 0.480154, 0.477423, 0.476201} *)

So the result is near to 0.476

ListLinePlot@res

Mathematica graphics

This is where I've read first about this way for using Integrate[]

added 137 characters in body
Source Link
Dr. belisarius
  • 116.2k
  • 13
  • 205
  • 456

This is perhaps too "creative". Some health checks needed for the series behavior:

Graphics`Region`RegionInit[];
region = (x x + 4 y y + 9 z z <= 1);
paregion = Region`ParametricRegion[{{x, y, z}, region}];
k = FullSimplify@
     Normal@Series[Sqrt[(1-9 z^2) (1-9 z^2-4 y^2)], {z,0, #},{y,0, #}] &/@ Range[1, 10, 2];
res = N@Integrate[#, {x, y, z} ∈ paregion] & /@ k

(* {0.698132, 0.488692, 0.480154, 0.477423, 0.476201} *)

So the result is near to 0.476

ListLinePlot@res

Mathematica graphics

This is where I've read first about this way for using Integrate[]

This is perhaps too "creative". Some health checks needed for the series behavior:

Graphics`Region`RegionInit[];
region = (x x + 4 y y + 9 z z <= 1);
paregion = Region`ParametricRegion[{{x, y, z}, region}];
k = FullSimplify@
     Normal@Series[Sqrt[(1-9 z^2) (1-9 z^2-4 y^2)], {z,0, #},{y,0, #}] &/@ Range[1, 10, 2];
res = N@Integrate[#, {x, y, z} ∈ paregion] & /@ k

(* {0.698132, 0.488692, 0.480154, 0.477423, 0.476201} *)

So the result is near to 0.476

ListLinePlot@res

Mathematica graphics

This is where I've read first about this way for using Integrate[]

deleted 43 characters in body
Source Link
Dr. belisarius
  • 116.2k
  • 13
  • 205
  • 456

This is perhaps too "creative". Some health checks needed for the series behavior:

Graphics`Region`RegionInit[];
region = (x x + 4 y y + 9 z z <= 1);
paregion = Region`ParametricRegion[{{x, y, z}, region}];
k = FullSimplify@Normal@Series[Sqrt[FullSimplify@
     Normal@Series[Sqrt[(1 - 9 z^2) (1 - 9 z^2 - 4 y^2)], {z, 0, #},{y, 0, #}] & 
                              /@ Range[1, 10, 2];
res = N@Integrate[#, {x, y, z} \[Element] paregion] & /@ k

(* {0.698132, 0.488692, 0.480154, 0.477423, 0.476201} *)

So the result is near to 0.476

ListLinePlot@res

Mathematica graphics

This is perhaps too "creative". Some health checks needed for the series behavior:

Graphics`Region`RegionInit[];
region = (x x + 4 y y + 9 z z <= 1);
paregion = Region`ParametricRegion[{{x, y, z}, region}];
k = FullSimplify@Normal@Series[Sqrt[(1 - 9 z^2) (1 - 9 z^2 - 4 y^2)], {z, 0, #},{y, 0, #}] & 
                              /@ Range[1, 10, 2];
res = N@Integrate[#, {x, y, z} \[Element] paregion] & /@ k

(* {0.698132, 0.488692, 0.480154, 0.477423, 0.476201} *)

So the result is near to 0.476

ListLinePlot@res

Mathematica graphics

This is perhaps too "creative". Some health checks needed for the series behavior:

Graphics`Region`RegionInit[];
region = (x x + 4 y y + 9 z z <= 1);
paregion = Region`ParametricRegion[{{x, y, z}, region}];
k = FullSimplify@
     Normal@Series[Sqrt[(1-9 z^2) (1-9 z^2-4 y^2)], {z,0, #},{y,0, #}] &/@ Range[1, 10, 2];
res = N@Integrate[#, {x, y, z}  paregion] & /@ k

(* {0.698132, 0.488692, 0.480154, 0.477423, 0.476201} *)

So the result is near to 0.476

ListLinePlot@res

Mathematica graphics

Source Link
Dr. belisarius
  • 116.2k
  • 13
  • 205
  • 456
Loading