I am trying to construct a function using NestList and plot the values. Although the individually used and defined functions in my notebook seem to do the right thing (have compared the outputs with an equivalent Python notebook), I am failing at the procedure. In particular, the performance is very poor, but this must be due to my implementation.
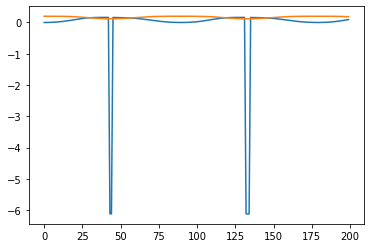
Background: The idea is to investigate error propagation function of qubit rotations (using $SU2$ rotations). Using Mathematica, I plan to use CAS features like simplifications or determining curve equations. The following plot shows the angular error after $n$ rotations of a qubit on the bloch sphere:

The corresponding Python Code looks as follows:
rot_x = pi/100
rot_y = pi/100
rot_z = pi/100
num_iterations = 200

start_vec = [1, 0, 0]
err = 0.2

x = np.arange(0, num_iterations, 1, dtype=int)
ϕ_error_propagation_vec = np.zeros(shape=(num_iterations))
θ_error_propagation_vec = np.zeros(shape=(num_iterations))

vec = start_vec
vec_err = qubitmatrix_to_cartesian(rn_su2_euler(start_vec, 0, err, 0))

for i in range(num_iterations):
    polar = cartesian_to_spherical(vec)
    polar_err = cartesian_to_spherical(vec_err)
    (ϕ_rotated, θ_rotated) = (polar[1], polar[2])
    (ϕ_rotated_err, θ_rotated_err) = (polar_err[1], polar_err[2])

    θ_error_propagation_vec[i] = θ_rotated_err - θ_rotated
    ϕ_error_propagation_vec[i] = ϕ_rotated_err - ϕ_rotated

    M_q_rotated = rn_su2_euler(vec, rot_x, rot_y, rot_z)
    M_q_rotated_err = rn_su2_euler(vec_err, rot_x, rot_y, rot_z)
    vec = qubitmatrix_to_cartesian(M_q_rotated)
    vec_err = qubitmatrix_to_cartesian(M_q_rotated_err)

plt.plot(x, ϕ_error_propagation_vec, θ_error_propagation_vec)
plt.show()
For the sake of completeness, I provided the whole working Notebook including all functions here on GitHub.
My question and approach: I reimplemented this script using Mathematica (v.13) as follows:
ClearAll["Global`*"];
qubitmatrixToCartesian[Mq_] := (
   q1 = Re[(Mq[[1, 2]] + Mq[[2, 1]])/2];
   q2 = Re[(Mq[[2, 1]] - Mq[[1, 2]])/(2*I)];
   q3 = Re[Mq[[1, 1]]];
   Return[{q1, q2, q3}];
   );
rnSU2euler[vec_, rx_, ry_, rz_] := (
   sphericalVec = ToSphericalCoordinates[vec];
   \[Theta] = sphericalVec[[2]];
   \[Phi] = sphericalVec[[3]];
   sx = PauliMatrix[1];
   sy = PauliMatrix[2];
   sz = PauliMatrix[3];
   Mq = Sin[\[Theta]]*Cos[\[Phi]]*sx + Sin[\[Theta]]*Sin[\[Phi]]*sy +
     Cos[\[Theta]]*sz;
   Un = {{Exp[-I*(rx + rz)/2]*Cos[ry/2], -Exp[-I*(rx - rz)/2]*
       Sin[ry/2]}, {Exp[I*(rx - rz)/2]*Sin[ry/2],
      Exp[I*(rx + rz)/2]*Cos[ry/2]}};
   Return [Un . Mq . ConjugateTranspose[Un]];
   );
rotateVector[vec_, rx_, ry_, rz_] := (
   MqRotated = rnSU2euler[vec, rx, ry, rz];
   Return[qubitmatrixToCartesian[MqRotated]];
   );
errorPropagation[n_, vec_, vecError_, rx_, ry_, rz_] := (
   v = N[NestList[rotateVector[#, rx, ry, rz] &, vec, n]];
   vErr = N[NestList[rotateVector[#, rx, ry, rz] &, vecError, n]];
   polar = Map[ToSphericalCoordinates, v];
   polarErr = Map[ToSphericalCoordinates, vErr];
   Return[MapThread[Subtract, {polar[[All, 2]], polarErr[[All, 2]]}]];
   );
ListPlot[errorPropagation[4, {1, 0, 0},
  N[rotateVector[{1, 0, 0}, 0, 0.02, 0]], Pi/100, Pi/100, Pi/100]]
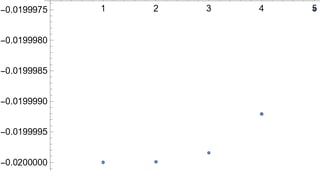
Unfortunately, the performance drops (the scripts hangs) after drawing 5 values. I strongly suspect that the function errorPropagation is implemented improperly:

The values seem to be plausible, and the individual functions work well. But I am doing at least something wrong with the way I am using NestList. I would be greatful for any help to get my script plotting the curves as depicted by the figure shown further above.