Added credit to Henrik Schumacher as to why the estimated PDF was greater to zero outside the borders.
Source Link
JimB
  • 42.9k
  • 3
  • 51
  • 108

Use@HenrikSchumacher explained why you're getting "leakage" outside of the fixed boundaries of your data generation process. Here's one way to account for the kind of borders you have: use the "Bounded" option:.

(* Generate some bounded data *)
data = RandomVariate[BinormalDistribution[{0, 0}, {1, 1}, 0.9], 5000];
data = Select[data, #[[1]] > -1 && -1 < #[[2]] < 1 &];

(* Get nonparametric density estimate *)
skd = SmoothKernelDistribution[data, 0.3, {"Bounded", {{-1, ∞}, {-1, 1}}, "Gaussian"}];

(* Show results *)
Show[ListPlot[data, PlotRange -> {{-1.5, 3}, {-1.5, 1.5}}, Frame -> True],
 ContourPlot[PDF[skd, {x, y}], {x, -1.5, 3}, {y, -1.5, 1.5},
  ContourShading -> None, PlotPoints -> 100]]

Bounded pdf and data points

And as a check see if pdf integrates to 1:

NIntegrate[PDF[skd, {x, y}], {x, -1, ∞}, {y, -1, 1}]
(* 1. *)

Use the "Bounded" option:

(* Generate some bounded data *)
data = RandomVariate[BinormalDistribution[{0, 0}, {1, 1}, 0.9], 5000];
data = Select[data, #[[1]] > -1 && -1 < #[[2]] < 1 &];

(* Get nonparametric density estimate *)
skd = SmoothKernelDistribution[data, 0.3, {"Bounded", {{-1, ∞}, {-1, 1}}, "Gaussian"}];

(* Show results *)
Show[ListPlot[data, PlotRange -> {{-1.5, 3}, {-1.5, 1.5}}, Frame -> True],
 ContourPlot[PDF[skd, {x, y}], {x, -1.5, 3}, {y, -1.5, 1.5},
  ContourShading -> None, PlotPoints -> 100]]

Bounded pdf and data points

And as a check see if pdf integrates to 1:

NIntegrate[PDF[skd, {x, y}], {x, -1, ∞}, {y, -1, 1}]
(* 1. *)
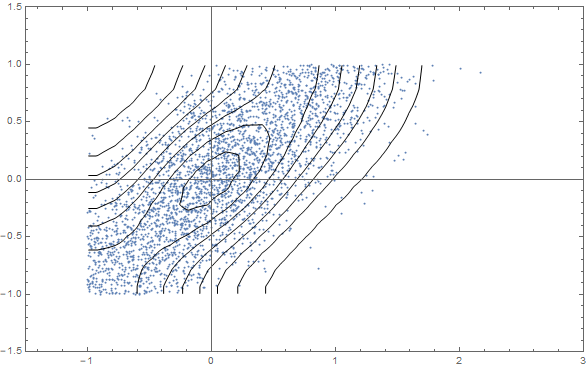
@HenrikSchumacher explained why you're getting "leakage" outside of the fixed boundaries of your data generation process. Here's one way to account for the kind of borders you have: use the "Bounded" option.

(* Generate some bounded data *)
data = RandomVariate[BinormalDistribution[{0, 0}, {1, 1}, 0.9], 5000];
data = Select[data, #[[1]] > -1 && -1 < #[[2]] < 1 &];

(* Get nonparametric density estimate *)
skd = SmoothKernelDistribution[data, 0.3, {"Bounded", {{-1, ∞}, {-1, 1}}, "Gaussian"}];

(* Show results *)
Show[ListPlot[data, PlotRange -> {{-1.5, 3}, {-1.5, 1.5}}, Frame -> True],
 ContourPlot[PDF[skd, {x, y}], {x, -1.5, 3}, {y, -1.5, 1.5},
  ContourShading -> None, PlotPoints -> 100]]

Bounded pdf and data points

And as a check see if pdf integrates to 1:

NIntegrate[PDF[skd, {x, y}], {x, -1, ∞}, {y, -1, 1}]
(* 1. *)
Source Link
JimB
  • 42.9k
  • 3
  • 51
  • 108

Use the "Bounded" option:

(* Generate some bounded data *)
data = RandomVariate[BinormalDistribution[{0, 0}, {1, 1}, 0.9], 5000];
data = Select[data, #[[1]] > -1 && -1 < #[[2]] < 1 &];

(* Get nonparametric density estimate *)
skd = SmoothKernelDistribution[data, 0.3, {"Bounded", {{-1, ∞}, {-1, 1}}, "Gaussian"}];

(* Show results *)
Show[ListPlot[data, PlotRange -> {{-1.5, 3}, {-1.5, 1.5}}, Frame -> True],
 ContourPlot[PDF[skd, {x, y}], {x, -1.5, 3}, {y, -1.5, 1.5},
  ContourShading -> None, PlotPoints -> 100]]

Bounded pdf and data points

And as a check see if pdf integrates to 1:

NIntegrate[PDF[skd, {x, y}], {x, -1, ∞}, {y, -1, 1}]
(* 1. *)