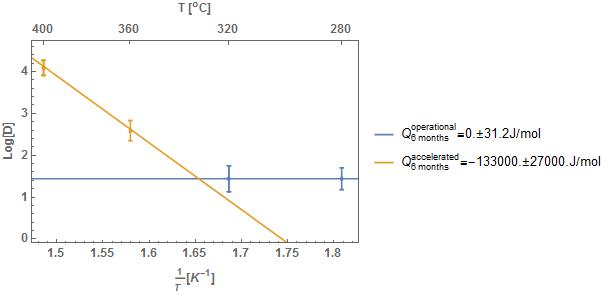
My code is too long, so I did not post the whole thing. Please just focus on the PlotLegend. I would like to convert it to Callouts.

 [![enter image description here][2]][2]
Rasterize[
 Show[EDAListPlot[Take[iwavelength6, 2] /. Datum -> Identity,
   Take[iwavelength6, -2] /. Datum -> Identity],
  Plot[{y1[[1]][[1]], y2[[1]][[1]]}, {x, 0.0014, 0.0019},
   PlotLegends -> {"\!\(\*SubsuperscriptBox[\(Q\), \(6\\\ months\), \
\(operational\)]\)=" <> ToString[q1[[1]]] <> "\[PlusMinus]" <>
      ToString[q1[[2]]] <> "J/mol",
     "\!\(\*SubsuperscriptBox[\(Q\), \(6\\\ months\), \
\(accelerated\)]\)=" <> ToString[q2[[1]]] <> "\[PlusMinus]" <>
      ToString[q2[[2]]] <> "J/mol"}], Frame -> True,
  FrameLabel -> {"\!\(\*FractionBox[\(1000\), \(\(\\\ \)\(T\)\(\\\ \\\
\ \)\)]\)[\!\(\*SuperscriptBox[\(K\), \(-1\)]\)]", "Log[D]",
    "T \!\(\*SuperscriptBox[\([\), \(o\)]\)C]"},
  LabelStyle -> Directive[Bold, Medium],
  PlotRange -> {{0.00148, 0.00182}, {0, 4.5}},
  FrameTicks -> {{Automatic, None}, {scaleTicks, upperTicks}}]]
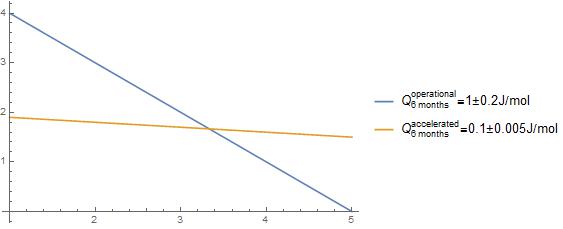
Here is an example that you can work with...
q1 = {1, .2}; q2 = {0.1, 0.005}; Plot[{5 - x, 2 - .1 x}, {x, 1, 5},
 PlotLegends -> {"\!\(\*SubsuperscriptBox[\(Q\), \(6\\\ months\), \
\(operational\)]\)=" <> ToString[q1[[1]]] <> "\[PlusMinus]" <>
    ToString[q1[[2]]] <> "J/mol",
   "\!\(\*SubsuperscriptBox[\(Q\), \(6\\\ months\), \
\(accelerated\)]\)=" <> ToString[q2[[1]]] <> "\[PlusMinus]" <>
    ToString[q2[[2]]] <> "J/mol"}]

