1
$\begingroup$

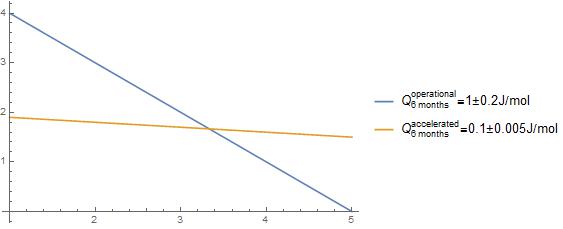
This question is very similar to How can I add a plot legend with variable value and text?. I had used this link to plot the graph below, with my slope calculated in the plot legend. However, this plot takes too much space. I would like to use callouts, to place the slope next to the line inside the plot. How would I do that? I have tried this for hours but nothing works. Please help me. Thanks

Rasterize[Show[EDAListPlot[Take[iwavelength6, 2] /. Datum -> Identity, Take[iwavelength6, -2] /. Datum -> Identity], Plot[{y1[[1]][[1]], y2[[1]][[1]]}, {x, 0.0014, 0.0019}, PlotLegends -> {"\!\(\*SubsuperscriptBox[\(Q\), \(6\\\ months\), \\(operational\)]\)=" <> ToString[q1[[1]]] <> "\[PlusMinus]" <> ToString[q1[[2]]] <> "J/mol", "\!\(\*SubsuperscriptBox[\(Q\), \(6\\\ months\), \\(accelerated\)]\)=" <> ToString[q2[[1]]] <> "\[PlusMinus]" <> ToString[q2[[2]]] <> "J/mol"}], Frame -> True, FrameLabel -> {"\!\(\*FractionBox[\(1\), \(\(T\)\(\\\ \\\ \\)\)]\)[\!\(\*SuperscriptBox[\(K\), \(-1\)]\)]", "Log[D]\))]", "T \!\(\*SuperscriptBox[\([\), \(o\)]\)C]"}, LabelStyle -> Directive[Bold, Medium], PlotRange -> {{0.00148, 0.00182}, {0, 4.5}}, FrameTicks -> {{Automatic, None}, {scaleTicks, upperTicks}}]]

My code is too long, so I did not post the whole thing. Please just focus on the PlotLegend. I would like to convert it to Callouts. enter image description here [![enter image description here][2]][2]
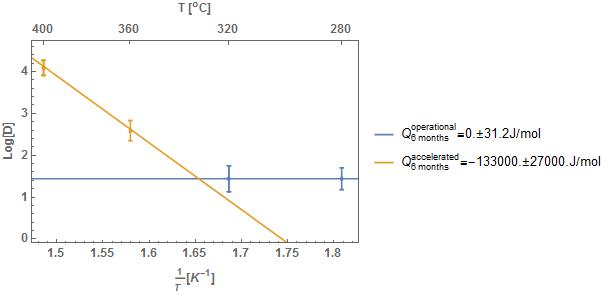
Rasterize[
 Show[EDAListPlot[Take[iwavelength6, 2] /. Datum -> Identity, 
   Take[iwavelength6, -2] /. Datum -> Identity], 
  Plot[{y1[[1]][[1]], y2[[1]][[1]]}, {x, 0.0014, 0.0019}, 
   PlotLegends -> {"\!\(\*SubsuperscriptBox[\(Q\), \(6\\\ months\), \
\(operational\)]\)=" <> ToString[q1[[1]]] <> "\[PlusMinus]" <> 
      ToString[q1[[2]]] <> "J/mol", 
     "\!\(\*SubsuperscriptBox[\(Q\), \(6\\\ months\), \
\(accelerated\)]\)=" <> ToString[q2[[1]]] <> "\[PlusMinus]" <> 
      ToString[q2[[2]]] <> "J/mol"}], Frame -> True, 
  FrameLabel -> {"\!\(\*FractionBox[\(1000\), \(\(\\\ \)\(T\)\(\\\ \\\
\ \)\)]\)[\!\(\*SuperscriptBox[\(K\), \(-1\)]\)]", "Log[D]", 
    "T \!\(\*SuperscriptBox[\([\), \(o\)]\)C]"}, 
  LabelStyle -> Directive[Bold, Medium], 
  PlotRange -> {{0.00148, 0.00182}, {0, 4.5}}, 
  FrameTicks -> {{Automatic, None}, {scaleTicks, upperTicks}}]]

Here is an example that you can work with...

q1 = {1, .2}; q2 = {0.1, 0.005}; Plot[{5 - x, 2 - .1 x}, {x, 1, 5}, 
 PlotLegends -> {"\!\(\*SubsuperscriptBox[\(Q\), \(6\\\ months\), \
\(operational\)]\)=" <> ToString[q1[[1]]] <> "\[PlusMinus]" <> 
    ToString[q1[[2]]] <> "J/mol", 
   "\!\(\*SubsuperscriptBox[\(Q\), \(6\\\ months\), \
\(accelerated\)]\)=" <> ToString[q2[[1]]] <> "\[PlusMinus]" <> 
    ToString[q2[[2]]] <> "J/mol"}]

enter image description here

$\endgroup$
3
  • $\begingroup$ I also posted the code, it just does not look as nice because it spells out 'superscript' and other things like that, instead of just putting the degree symbol. I am looking into how to paste the code in a better way... $\endgroup$
    – SarahM
    Commented Sep 13, 2017 at 7:14
  • $\begingroup$ I am stuck on how to use Callouts, where I can also assign values and text like the way I did with PlotLegends. Nothing is working. $\endgroup$
    – SarahM
    Commented Sep 13, 2017 at 7:15
  • $\begingroup$ Ok, will do so now $\endgroup$
    – SarahM
    Commented Sep 13, 2017 at 7:23

1 Answer 1

3
$\begingroup$

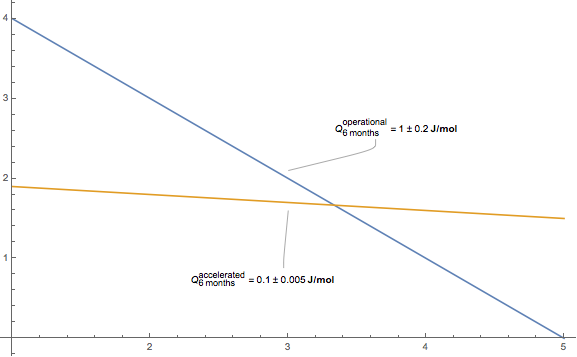
Here's a fairly explicit way of placing things with Callout that should hopefully clarify what the various arguments can do.

First I'll define expressions formatted the way I like for labels.

Clear[formatQ]; 
formatQ[lab_, data__] := 
 DisplayForm[ 
  RowBox[{SubsuperscriptBox["Q", "6 months", lab], "=", data[[1]], 
    "\[PlusMinus]", data[[2]], Style["J/mol", Bold]}]]

q1 = {1, .2}; q2 = {0.1, 0.005};
labels = MapThread[
   formatQ, {{"operational", "accelerated"}, {q1, q2}}];

I figure out where I want the labels to show up in the plot, as well as where along the function I want the anchor points (where the label-callout-lines should hit the plot-lines).

whereDoYouWantLabels = 
  MapIndexed[{3.3, 2 ( 3 - 2 #2[[1]])/3 + (# /. x -> 3.3) } &, {5 - x, 2 - .1 x}]

{{3.63333, 2.36667}, {2.96667, 1.00333}}

whereDoYouWantThemAnchored = 
  MapIndexed[{3, (# /. x -> 3) + ( 3 - 2 #2[[1]])/10 } &, {5 - x, 2 - .1 x}]

{{3, 21/10}, {3, 1.6}}

Then simply plot:

Plot[MapThread[
   Callout, {{5 - x, 2 - .1 x}, labels, whereDoYouWantLabels, 
    whereDoYouWantThemAnchored}] // Evaluate, {x, 1, 5}, 
 PlotRange -> All]

yielding:

enter image description here


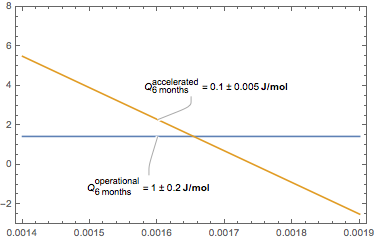
Update: So going to play this game again a little slower with some new functions as per comments.

So here are the two new functions in x:

y1 = 1.44; y2 = 27.9 - 16000 x;

The label settings we'll care about will want to know something about where to lay things out (range of x, range of y we want to display etc).

xRange = {.0014, .0019};  midX = Mean@xRange; 
xLength = xRange[[2]] - xRange[[1]]; 
yRange = {-3, 8}; yLength=yRange[[2]]-yRange[[1]];

Let's place the labels first:

whereDoYouWantLabels = 
 MapIndexed[
  Block[{myX = midX + (#2[[1]] - 2) xLength/8},
      {myX, -2 (3 - 2 #2[[1]])/3 * yLength/5 + (# /. x -> myX)}] &, 
  {y1, y2}]

Let me break this down. Before the ranges were nice and friendly and I could grossly shift things around, here it's a little more delicate so I'm going to be careful.

What I want to do given how the lines look in the plot is place the labels by finding midpoint in x, and shift it either a little left or not at all depending on whether we are talking about y1 or y2, and then shifting it up or down from the line whether it is y1 or y2.

I do it by explicitly considering the functions y1 and y2 using MapIndexed.

Here is what MapIndexed is doing, every #2[[1]] is replaced by the index number of the element (1 or 2), and # is replaced by the element (y1 or y2):

 whereDoYouWantLabels === {
  Block[{myX = midX + (1 - 2) xLength/8}, {myX, -2 (3 - 2)/
       3*yLength/5 + (y1 /. x -> myX)}], 
  Block[{myX = midX + (2 - 2) xLength/8}, {myX, -2 (3 - 4)/
       3*yLength/5 + (y2 /. 
       x -> myX)}]} ===
  {{(midX - xLength/8), -2/3 * yLength/5 + 
                       (y1 /. x -> (midX - xLength/8))}, 
   {midX, + 2/3 * yLength/5 + (y2 /. x -> midX)}}  

Now the anchorpoints:

whereDoYouWantThemAnchored = 
 MapIndexed[
  Block[{myX = midX  .97}, {myX, (# /. x -> myX)}] &, {y1, y2}]

In this case I just want it to anchor a little less then midpoint (where evidently they exactly cross). MapIndexed here is simply doing:

whereDoYouWantThemAnchored === {  { .97 midX, y1/.x->.97 midX},
                                {.97 midX, y2/.x->.97 midX} }

Now plotting:

Plot[MapThread[
   Callout, {{y1, y2}, labels, whereDoYouWantLabels, 
    whereDoYouWantThemAnchored}] // Evaluate, Prepend[x][xRange], 
 PlotRange -> yRange, Axes -> False, Frame -> True]

yielding:

enter image description here

If I don't want the anchor lines to exactly touch the plot, I may do something like:

whereDoYouWantThemAnchored = 
 MapIndexed[
  Block[{myX = midX  .97}, 
   {myX, (#/.x->myX)+ -2(3 - 2 #2[[1]])/3 * yLength/25}] &, {y1, y2}]

i.e. shifting a little up or down to give a little air depending on which function.


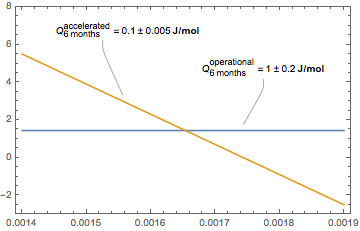
Update${}^{\mathbf 2}$: What if we want both labels to be above the lines?

We'll need to make sure the x's of the labels are separated enough, and we'll want both y's of the labels to be above the lines.

What do we modify?

whereDoYouWantLabels = 
 MapIndexed[
  Block[{myX = midX + 2 (3 - 2 #2[[1]]) xLength/8}, {myX, 
     yLength/5 + (# /. x -> myX)}] &, {y1, y2}]

whereDoYouWantThemAnchored = 
 MapIndexed[
  Block[{myX = 
      midX + .75*2*(3 - 2 #2[[1]]) xLength/8}, {myX, (# /. x -> myX) + 
      yLength/35}] &, {y1, y2}]

yielding:

enter image description here

Just to belabour the point of what the MapIndexed functions are doing, here's what the label pos looks like in terms of a Table command:

whereDoYouWantLabels === Table[ 
     Block[{myX = midX + If[i === 1, 1, -1] 2*xLength/8}, {myX, 
    yLength/5 + ( {y1, y2}[[i]] /. x -> myX)}], {i, 1, 2}]

(yielding True)

$\endgroup$
11
  • $\begingroup$ Hi John, thank you for your answer. I am trying to follow your example to my original question. I am wondering how to automatically change the location of the labels and where it is anchored when I have different lines to plot. $\endgroup$
    – SarahM
    Commented Sep 13, 2017 at 17:53
  • $\begingroup$ Hi @SarahM, I'm assuming your functions are pretty complicated, in which case "automatic" callout locations tend to be pretty lackluster. I've found getting decent Calloust to be more or less a manual process (to avoid overwriting lines, other callouts etc). I made both label positions and anchor points a little "automatic" above using MapIndexed and the actual functions to shift things around. I will explain this in more depth a little later. Please ask very explicit questions and I will do what I can to help. $\endgroup$ Commented Sep 13, 2017 at 18:15
  • $\begingroup$ I changed the equations to: y1=1.44 and y2=27.9 - 16000 x. The label and anchor position do not have a problem with y1, which is a horizontal line. I changed: whereDoYouWantLabels = MapIndexed[{0.0016, 2 (3 - 2 #2[[1]])/3000 + (# /. x -> 0.0016)} &, {1.44 - 0. x, 27.9 - 16000 x}] and whereDoYouWantThemAnchored = MapIndexed[{0.0017, (# /. x -> 0.0017) + (3 - 2 #2[[1]])/ 10} &, {1.44 - 0. x, 27.9 - 16000 x}] to accomodate the new equations. I have still not fully understood how mapIndex works, but the resulting positions were not ideal... $\endgroup$
    – SarahM
    Commented Sep 13, 2017 at 18:54
  • $\begingroup$ ...A bigger problem is that Plot[MapThread[ Callout, {{y1, y2}, labels, whereDoYouWantLabels, whereDoYouWantThemAnchored}] // Evaluate, {x, .0014, .0019}, PlotRange -> All] gives me errors of dividing by 0. I think this is because y1 is a horizontal line with no slope. $\endgroup$
    – SarahM
    Commented Sep 13, 2017 at 19:00
  • 1
    $\begingroup$ Yes the range of x-values are from 0.0014 to 0.0018 (inverse temp). Therefore, the scale is not way off. The plot in the question is of these two equations: y1 and y2 $\endgroup$
    – SarahM
    Commented Sep 13, 2017 at 19:29

Your Answer

By clicking “Post Your Answer”, you agree to our terms of service and acknowledge you have read our privacy policy.

Not the answer you're looking for? Browse other questions tagged or ask your own question.