Simplify the code a bit.
Source Link
xzczd
  • 68.4k
  • 9
  • 174
  • 489

Another possible solution is to

  1. ContourPlot the equation directly;

  2. Make the coordinate transform on the coordinates of points inside the resulting graphic.

I've wrapped these steps in a function:

ClearAll@implicitPlot
implicitPlot[eq_, range__, coordSys_, opt : OptionsPattern[ContourPlot]] := 
 Module[{coord}, 
  With[{plot = ContourPlot[eq, range, opt, PlotRange -> All], 
    trans = #[coord, #2] &[Function, 
       CoordinateTransform[coordSys -> "Cartesian", {coord[1], coord[2]}]] /. 
      coord[i_] :> Part[coord, i]}, 
   Module[{plot = ContourPlot[eq, range, opt, PlotRange -> All]},
    plot /. 
     GraphicsComplex[coord_, rest_] :> 
      GraphicsComplex[trans[coord\[Transpose]]\[Transpose], rest]]]]rest]]]
    
implicitPlot[Cos@r == theta, {r, 0, 40}, {theta, -8 Pi, 8 Pi}, "Polar", 
 PlotPoints -> 100]
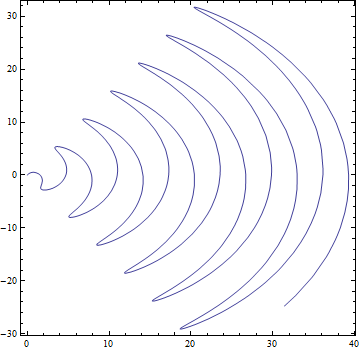
Mathematica graphics

The advantage of this approach is, it allows us to directly set domain of definition under the interested coordinate system.

Another possible solution is to

  1. ContourPlot the equation directly;

  2. Make the coordinate transform on the coordinates of points inside the resulting graphic.

I've wrapped these steps in a function:

ClearAll@implicitPlot
implicitPlot[eq_, range__, coordSys_, opt : OptionsPattern[ContourPlot]] := 
 Module[{coord}, 
  With[{trans = #[coord, #2] &[Function, 
       CoordinateTransform[coordSys -> "Cartesian", {coord[1], coord[2]}]] /. 
      coord[i_] :> Part[coord, i]}, 
   Module[{plot = ContourPlot[eq, range, opt, PlotRange -> All]},
    plot /. 
     GraphicsComplex[coord_, rest_] :> 
      GraphicsComplex[trans[coord\[Transpose]]\[Transpose], rest]]]]

implicitPlot[Cos@r == theta, {r, 0, 40}, {theta, -8 Pi, 8 Pi}, "Polar", 
 PlotPoints -> 100]

Mathematica graphics

The advantage of this approach is, it allows us to directly set domain of definition under the interested coordinate system.

Another possible solution is to

  1. ContourPlot the equation directly;

  2. Make the coordinate transform on the coordinates of points inside the resulting graphic.

I've wrapped these steps in a function:

ClearAll@implicitPlot
implicitPlot[eq_, range__, coordSys_, opt : OptionsPattern[ContourPlot]] := 
 Module[{coord}, 
  With[{plot = ContourPlot[eq, range, opt, PlotRange -> All], 
    trans = #[coord, #2] &[Function, 
       CoordinateTransform[coordSys -> "Cartesian", {coord[1], coord[2]}]] /. 
      coord[i_] :> Part[coord, i]}, 
   plot /. GraphicsComplex[coord_, rest_] :> 
     GraphicsComplex[trans[coord\[Transpose]]\[Transpose], rest]]]
    
implicitPlot[Cos@r == theta, {r, 0, 40}, {theta, -8 Pi, 8 Pi}, "Polar", 
 PlotPoints -> 100]

Mathematica graphics

The advantage of this approach is, it allows us to directly set domain of definition under the interested coordinate system.

Make the function more stable (in principle).
Source Link
xzczd
  • 68.4k
  • 9
  • 174
  • 489

Another possible solution is to

  1. ContourPlot the equation directly;

  2. Make the coordinate transform on the coordinates of points inside the resulting graphic.

I've wrapped these steps in a function:

ClearAll@implicitPlot
implicitPlot[eq_, range__, coordSys_, opt : OptionsPattern[ContourPlot]] := 
 Module[{coord}, 
  With[{trans = #[coord, #2] &[Function, 
       CoordinateTransform[coordSys -> "Cartesian", {coord[1], coord[2]}]] /. 
      coord[i_] :> Part[coord, i]}, 
   Module[{plot = ContourPlot[eq, range, opt, PlotRange -> All]},
    plot[[1,plot 1]]/. = 
 trans[plot[[1    GraphicsComplex[coord_, 1]]\[Transpose]]\[Transpose];rest_] plot]]]:> 
      GraphicsComplex[trans[coord\[Transpose]]\[Transpose], rest]]]]

implicitPlot[Cos@r == theta, {r, 0, 40}, {theta, -8 Pi, 8 Pi}, "Polar", 
 PlotPoints -> 100]

Mathematica graphics

The advantage of this approach is, it allows us to directly set domain of definition under the interested coordinate system.

Another possible solution is to

  1. ContourPlot the equation directly;

  2. Make the coordinate transform on the coordinates of points inside the resulting graphic.

I've wrapped these steps in a function:

ClearAll@implicitPlot
implicitPlot[eq_, range__, coordSys_, opt : OptionsPattern[ContourPlot]] := 
 Module[{coord}, 
  With[{trans = #[coord, #2] &[Function, 
       CoordinateTransform[coordSys -> "Cartesian", {coord[1], coord[2]}]] /. 
      coord[i_] :> Part[coord, i]}, 
   Module[{plot = ContourPlot[eq, range, opt, PlotRange -> All]},
    plot[[1, 1]] = trans[plot[[1, 1]]\[Transpose]]\[Transpose]; plot]]]

implicitPlot[Cos@r == theta, {r, 0, 40}, {theta, -8 Pi, 8 Pi}, "Polar", 
 PlotPoints -> 100]

Mathematica graphics

The advantage of this approach is, it allows us to directly set domain of definition under the interested coordinate system.

Another possible solution is to

  1. ContourPlot the equation directly;

  2. Make the coordinate transform on the coordinates of points inside the resulting graphic.

I've wrapped these steps in a function:

ClearAll@implicitPlot
implicitPlot[eq_, range__, coordSys_, opt : OptionsPattern[ContourPlot]] := 
 Module[{coord}, 
  With[{trans = #[coord, #2] &[Function, 
       CoordinateTransform[coordSys -> "Cartesian", {coord[1], coord[2]}]] /. 
      coord[i_] :> Part[coord, i]}, 
   Module[{plot = ContourPlot[eq, range, opt, PlotRange -> All]},
    plot /.  
     GraphicsComplex[coord_, rest_] :> 
      GraphicsComplex[trans[coord\[Transpose]]\[Transpose], rest]]]]

implicitPlot[Cos@r == theta, {r, 0, 40}, {theta, -8 Pi, 8 Pi}, "Polar", 
 PlotPoints -> 100]

Mathematica graphics

The advantage of this approach is, it allows us to directly set domain of definition under the interested coordinate system.

Source Link
xzczd
  • 68.4k
  • 9
  • 174
  • 489

Another possible solution is to

  1. ContourPlot the equation directly;

  2. Make the coordinate transform on the coordinates of points inside the resulting graphic.

I've wrapped these steps in a function:

ClearAll@implicitPlot
implicitPlot[eq_, range__, coordSys_, opt : OptionsPattern[ContourPlot]] := 
 Module[{coord}, 
  With[{trans = #[coord, #2] &[Function, 
       CoordinateTransform[coordSys -> "Cartesian", {coord[1], coord[2]}]] /. 
      coord[i_] :> Part[coord, i]}, 
   Module[{plot = ContourPlot[eq, range, opt, PlotRange -> All]},
    plot[[1, 1]] = trans[plot[[1, 1]]\[Transpose]]\[Transpose]; plot]]]

implicitPlot[Cos@r == theta, {r, 0, 40}, {theta, -8 Pi, 8 Pi}, "Polar", 
 PlotPoints -> 100]

Mathematica graphics

The advantage of this approach is, it allows us to directly set domain of definition under the interested coordinate system.