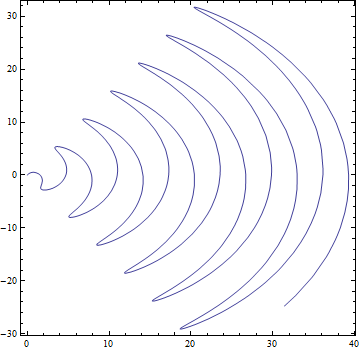
Another possible solution is to
1. `ContourPlot` the equation directly;
2. Make the coordinate transform on the coordinates of points inside the resulting graphic.
I've wrapped these steps in a function:
ClearAll@implicitPlot
implicitPlot[eq_, range__, coordSys_, opt : OptionsPattern[ContourPlot]] :=
Module[{coord},
With[{trans = #[coord, #2] &[Function,
CoordinateTransform[coordSys -> "Cartesian", {coord[1], coord[2]}]] /.
coord[i_] :> Part[coord, i]},
Module[{plot = ContourPlot[eq, range, opt, PlotRange -> All]},
plot[[1, 1]] = trans[plot[[1, 1]]\[Transpose]]\[Transpose]; plot]]]
implicitPlot[Cos@r == theta, {r, 0, 40}, {theta, -8 Pi, 8 Pi}, "Polar",
PlotPoints -> 100]

The advantage of this approach is, it allows us to directly set domain of definition under the interested coordinate system.